

AUDCAD 30-minute chart Retracement Sell Signal [RCI three-line + mBDSR]
※Campaign is ongoing until January 10, 2019.
BODSOR (mBDSR)sales page ishere.
※ BODSOR is an indicator developed to improve the entry accuracy when using three RCI lines for pullback buying or pullback selling.
This time, a bonus indicator 【mBDSR】 has been included with 【BODSOR】.
【mBDSR】 (bonus indicator):
The development concept is the same as for 【BODSOR】, but the arrow signal conditions and their calculation method are completely
different.
Since more arrow signals occur than with BODSOR, there is a higher possibility of capturing entry opportunities that could not be captured with 【BODSOR】.
The figure below is a chart of AUDCAD 30 minutes.
AUDCAD 30-minute chart (December 13–14, 2018)
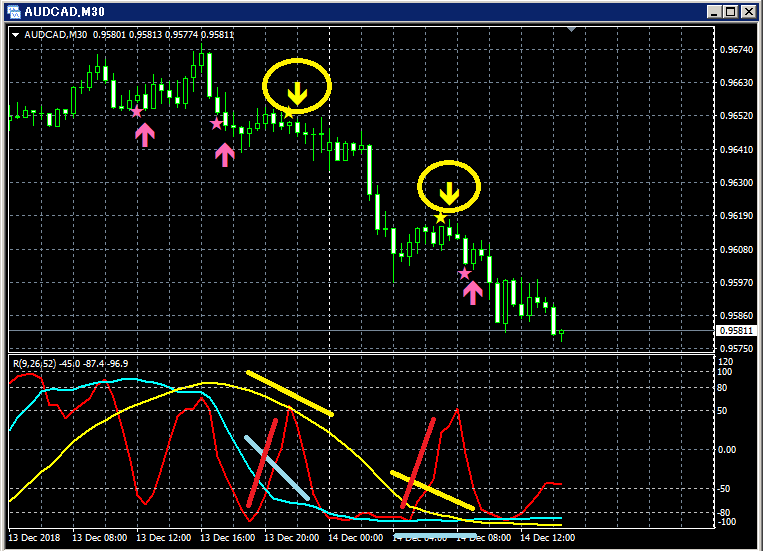
Upper panel: mBDSR
Among the three RCI lines, only RCI9 is clearly rising.
If RCI9 turns downward, all three RCI lines may turn downward.
In other words, price may fall strongly.
In such a situation, mBDSR’s pullback sell signals (yellow arrows circled in circles) light up.
In the above example, such pullback sell signals light up twice, but in both cases the timing of the start of the decline seems well captured.
BODSOR (mBDSR) sales page ishere.

Twitter
https://twitter.com/RCIX3Line
Blog
http://bodsor.blog.fc2.com/
Invest Navi+
https://fx-on.com/navi/serial/?id=359
YouTube
https://www.youtube.com/channel/UCL-g5uAlesiWVJEDtWlFvGw
Example of buy-the-dip and pullback sell signals in USD/JPY on a 1-hour chart
※In this article, for convenience in explanation, charts may include added circles, straight lines, squares, etc., so please understand.


