

From the sign of "RCI3 Three-Line + mBDSR" the flow of trend reversal (CAD/JPY 5-minute chart)
※Campaign is ongoing until January 10, 2019.
The sales page for BODSOR (mBDSR) ishere.
※ BODSOR is an indicator developed to improve the entry accuracy when making pullback buys or pullback sells using the RCI3-line.
It is designed to enhance entry opportunities.
This time, a bonus indicator【mBDSR】 is附属 with 【BODSOR】.
【mBDSR】(Bonus Indicator):
The development concept is the same as for【BODSOR】, but the arrow signal generation conditions and its calculation method are completely different.
Because more arrow signals appear than with【BODSOR】, there is a higher potential to capture entry opportunities that could not be captured with【BODSOR】.
The figure below is a 5-minute chart of USD/JPY.
USD/JPY 5-minute chart (December 14, 2018)
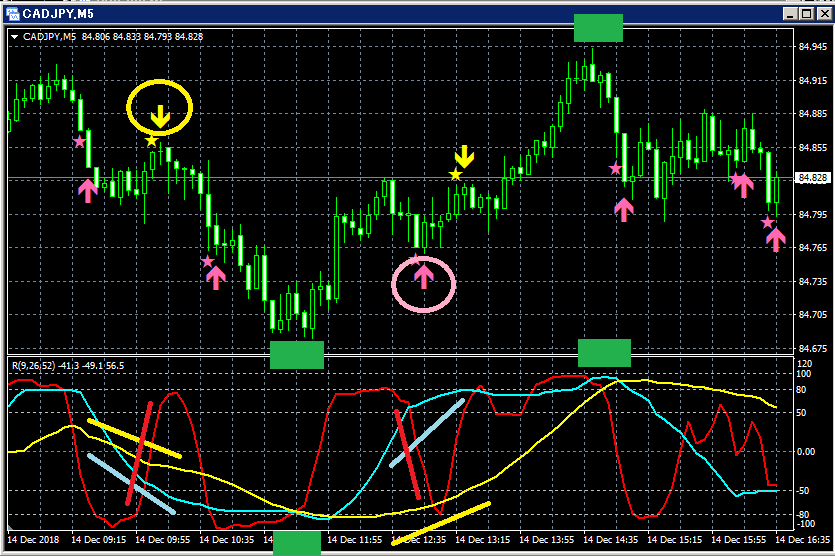
Top: mBDSR
(1) Reversal-selling signal
Only RCI9 among the three RCI lines is clearly rising.If RCI9 reverses downward, all three RCI lines may move downward.
In other words, the price may experience a strong decline.
In such a situation,mBDSR’s reversal-selling signal (yellow arrow circled) lights up.
After the signal lights, the price has been declining smoothly, as can be seen.
(2) Downward move close to a so-called triple bottom in RCI
(3) RCI52 turns upward
(4) Pullback buying
Among the three RCI lines, the only one clearly downward is RCI9.If RCI9 reverses upward, all three RCIs may rise.
In other words, the price may rise strongly.
(5) Rise close to a so-called triple top in RCI
(6) RCI52 turns downward
BODSOR (mBDSR) sales page ishere.

Twitter
https://twitter.com/RCIX3Line
Blog
http://bodsor.blog.fc2.com/
Investment Navi+
https://fx-on.com/navi/serial/?id=359
YouTube
https://www.youtube.com/channel/UCL-g5uAlesiWVJEDtWlFvGw
Examples of pullback buying and retracement selling signals on USD/JPY 1-hour chart
※In the charts in this article, for convenience of explanation, prices, lines, and squares may be added, so please understand.
.


