

Today’s AUD/JPY 5-minute chart Retracement Sell Signal 【RCI 3-line + mBDSR】
※Campaign is ongoing until January 10, 2019.
The sales page for BODSOR (mBDSR) is here.
※BODSOR is an indicator developed to improve the entry precision when using the RCi3 three-line setup for breakout buying or pullback selling.
This time, a bonus indicator 【mBDSR】 has been included with 【BODSOR】.
【mBDSR】(Bonus indicator):
The development concept is the same as 【BODSOR】, but the arrow signal generation conditions and its calculation method are completely different.
Because more arrow signals occur than with 【BODSOR】, there is a higher possibility of capturing entry opportunities that could not be caught with 【BODSOR】.
The figure below is the AUD/JPY 5-minute chart.
AUD/JPY 5-minute chart (December 14, 2018)
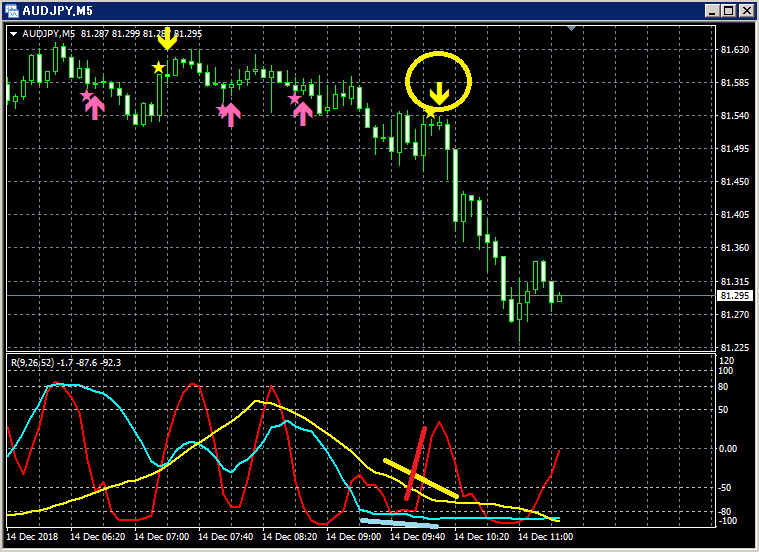
Upper section: mBDSR
Among the three RCI lines, only RCI9 is clearly rising.
If RCI9 reverses downward, the three RCIs may all trend downward.
In other words, the price could also fall strongly.
In such a situation, the mBDSR’s pullback sell signal (yellow arrow encircled) lights up.
Right after the signal lights up, a small bullish candle appears, but the price retraces within a few pips and remains within a small range,
and it seems to capture the timing of a downside move well.
The sales page for BODSOR (mBDSR) is here.

Twitter
https://twitter.com/RCIX3Line
Blog
http://bodsor.blog.fc2.com/
Investment Navi+
https://fx-on.com/navi/serial/?id=359
YouTube
https://www.youtube.com/channel/UCL-g5uAlesiWVJEDtWlFvGw
Examples of Buy-on-dips and Sell-on-rallies on the USD/JPY 1-hour chart
※Note: In the charts in this article, for ease of explanation, circles, lines, and rectangles may be drawn.
Please understand.


