

【A Definitive Guide: Master RCI!!】From the daily chart down to lower timeframes, waiting for the mBDSR signal on the 5-minute chart
【Master RCI to Win Extremely!! Trend Reversal, Buy Dips, Sell Rallies】
An indicator that shines in combination with RCI: 【BODSOR・mBDSR】
and its methods and case studies (PDF) ★GogoJungle AWARD2020 winner★
https://www.gogojungle.co.jp/tools/indicators/11836
The PDF files amount to 358 files (over 1,400 pages, over 470,000 characters in total) included.
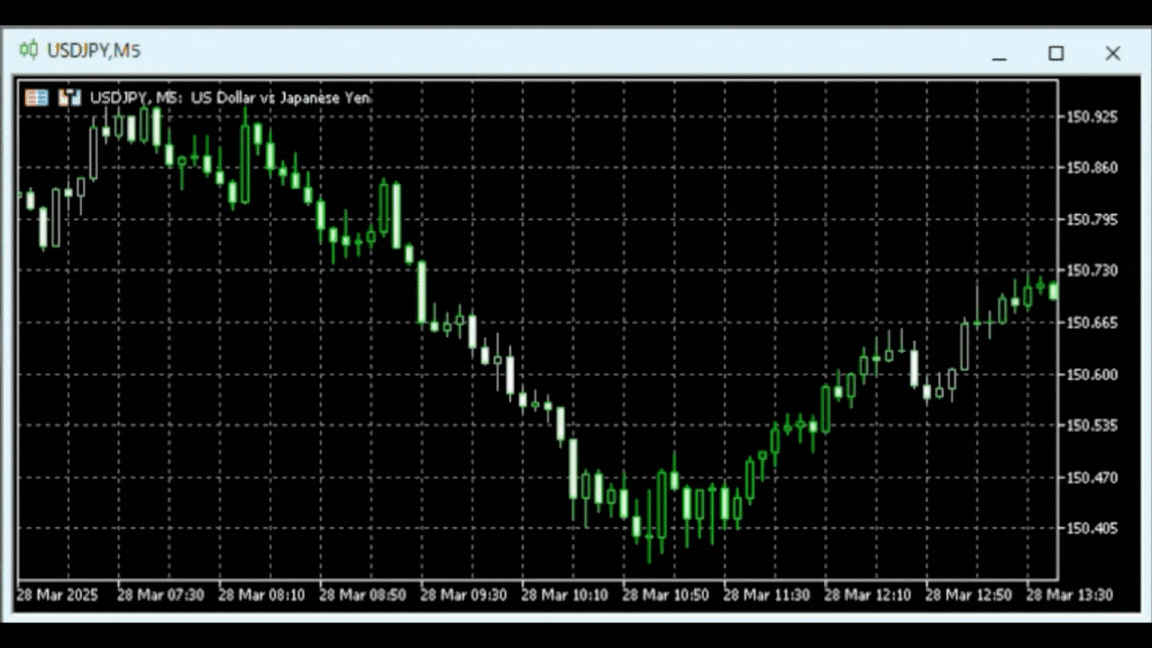
March 28, 2025 USD/JPY 5-minute chart +75 pips
At the beginning of this year, the MT5 version Beta was released!!
mBDSR (Product ID 11836) Purchase Bonus】MT5 version indicator (Beta)
“mBDSR (no filter, RCI filter, MA filter)”
https://www.gogojungle.co.jp/tools/indicators/56765
To help you utilize the MT5 version of mBDSR more effectively, an additional 62 PDFs (over 210 pages, over 200 chart pages, over 80,000 characters in total) have been added.
This article is a summary of content from the PDF that comes with the product“mBDSRhint_MT5_62_20250329.pdf”and is released free of charge within its permissible scope.
This description uses the USDJPY chart from March 28 as an example.
USDJPY Daily
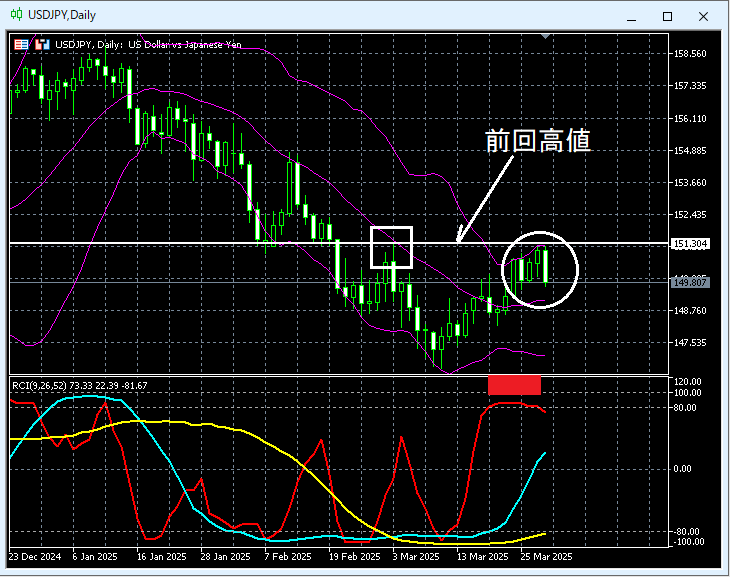
In the area circled in white on the above daily chart,Bollinger Band +2σandthe line showing the previous highoverlap and rise up to that point.Considering that the short-term RCI, RCI9, is stuck in the overbought zone(around the red square), it isn’t unreasonable to think there might be a slight pullback.
Here,Using the three-line RCIallows you to translate to lower timeframes like solving a puzzle to determine which next timeframe to view, but the explanation of this method is left to the accompanying PDF. Next, we look at the 1-hour chart, which has solid justification; we didn’t decide to view the 1-hour chart out of the blue.
USDJPY 1-hour
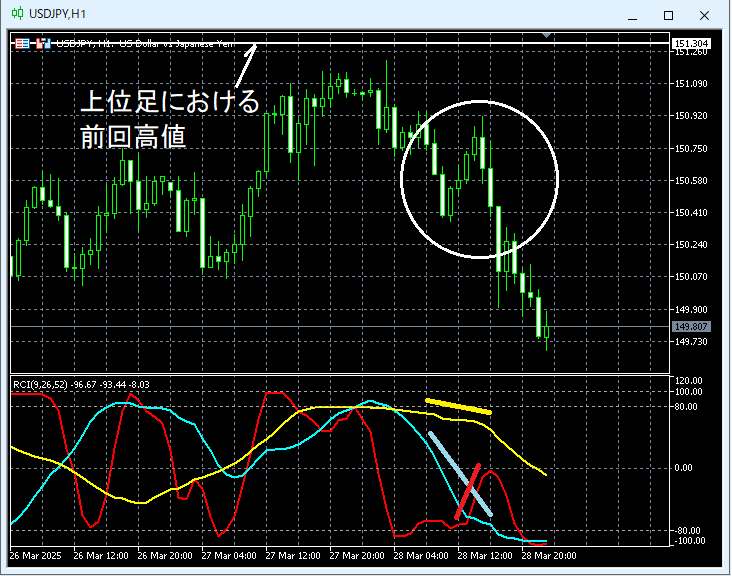
Around the circled area on the above 1-hour chart,“let’s check if there is a signal for selling on rallies”.
As we monitor the chart,the only RCI3-line that is clearly rising is RCI9, and the shape of the RCI3-line suggests a possible pullback, making it reasonable to consider selling on rallies. Here, we decide to examine lower timeframes in more detail.
Here,RCI3-lineallows us to translate to lower timeframes like solving a puzzle to determine which next timeframe to view, but the explanation of this method is left to the accompanying PDF. Next, we look at the 5-minute chart, which has solid justification; we did not start by looking at the 5-minute chart out of the blue.
USDJPY 5-minute

Watching the move on the above 5-minute chart,the mBDSR (2-filter RCI) sell signallights up, and the price subsequently declines smoothly. In this example, by selling on the 5-minute pullback signal and taking profits at the timing described in the included PDF, you would have earned +75 pips.
From this example,the high compatibility between trades that focus on RCI3-line, previous highs, and Bollinger Bands, and the signals from mBDSRis evident.
※Please note that in the charts shown in this article, for convenience of explanation, circles, lines, and squares may have been added.
Indicators that are powerful in combination with RCI: 【BODSOR・mBDSR】
and their methods and case studies (PDF) ★GogoJungle AWARD2020 winner★
https://www.gogojungle.co.jp/tools/indicators/11836
The PDF files amount to 358 files (over 1,400 pages, over 470,000 characters in total).
Most of them are compiled as examples that link higher and lower timeframes logically using the three-line RCI, sequentially analyzing multiple lower timeframes, and ultimately waiting for an entry timing (the mBDSR signal) for buying on dips or selling on rallies on the lower timeframes.
Additionally,many of them focus on identifying points where multiple entry grounds coincide..
Furthermore,the method for exploring upward and downward targets using the three-line RCIis also included.
In the PDF explanations,over 1,350 chartsare used.

× ![]()


