

【RCI3 main line + mBDSR】EURUSD 5-minute chart pullback buy signal
Campaign is ongoing until January 10, 2019.
BODSOR (mBDSR)sales page ishere.
BODSOR is an indicator developed to improve entry accuracy when using the RCİ 3 lines to implement pullback buys or pullback sells.
This time, an add-on indicator 【mBDSR】 is included with 【BODSOR】.
【mBDSR】 (add-on indicator):
The development concept is the same as 【BODSOR】, but the arrow sign generation conditions and their calculation methods are completely different.
There are more arrow signs than in 【BODSOR】, so it is more likely to capture entry opportunities that could not be captured with 【BODSOR】.
Thus, it increases the possibility of capturing entry opportunities that could not be captured with BODSOR.
The figure below is a 5-minute EUR/USD chart.
EUR/USD 5-minute chart (December 13, 2018)
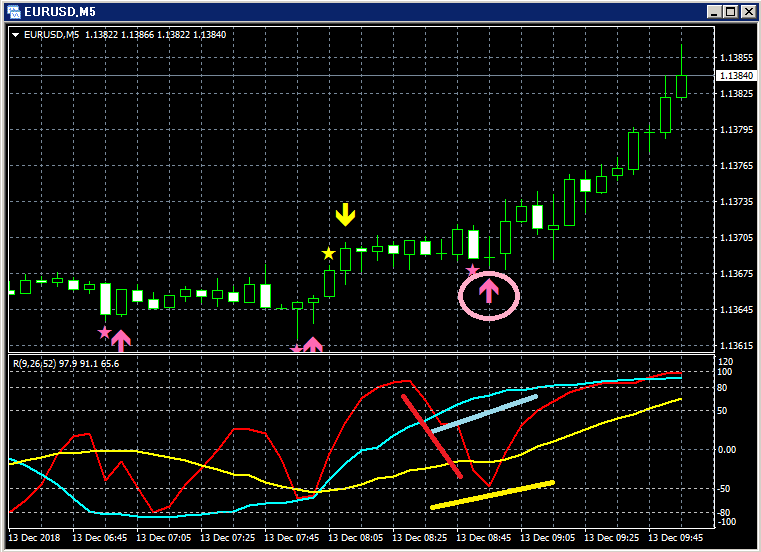
Lower row: Three-line RCI (red: RCI9, light blue: RCI26, yellow: RCI52)
Among the three RCI lines, only RCI9 is clearly declining.
If RCI9 reverses and rises, all three RCI lines may rise together.
In other words, price may rise strongly.
In such a situation, the mBDSR’s pullback buy signal (pink arrows circled) lights up.
After the signal lights up, price rises smoothly and continues to rise.
Note that the reversal rise of the declining RCI9 is confirmed after the pullback buy signal lights up and a solid bullish candle forms.
BODSOR (mBDSR) sales page ishere.

https://twitter.com/RCIX3Line
Blog
http://bodsor.blog.fc2.com/
Investment Navigator Plus
https://fx-on.com/navi/serial/?id=359
YouTube
https://www.youtube.com/channel/UCL-g5uAlesiWVJEDtWlFvGw
Examples of pullback buys and pullback sells on USD/JPY 1-hour chart
※The charts in this article may include circles, lines, or boxes for convenience of explanation; please note this.


