

【RCI3 Three-Line + mBDSR】 EUR/USD 5-minute chart Retracement Sell Signal
※Campaign is ongoing until January 10, 2019.
The BODSOR sales page here.
※ BODSOR is an indicator developed to improve entry accuracy when buying on dips or selling on rallies using three RCI lines.
This time, a bonus indicator 【mBDSR】 has been included with 【BODSOR】.
【mBDSR】 (bonus indicator):
The development concept is the same as 【BODSOR】, but the arrow sign generation conditions and its calculation method are completely different.
Since more arrow signs appear than with 【BODSOR】, there is a higher possibility of capturing entry opportunities that could not be caught with 【BODSOR】.
The figure below is a 5-minute EUR/USD chart.
EUR/USD 5-minute chart (December 13, 2018)
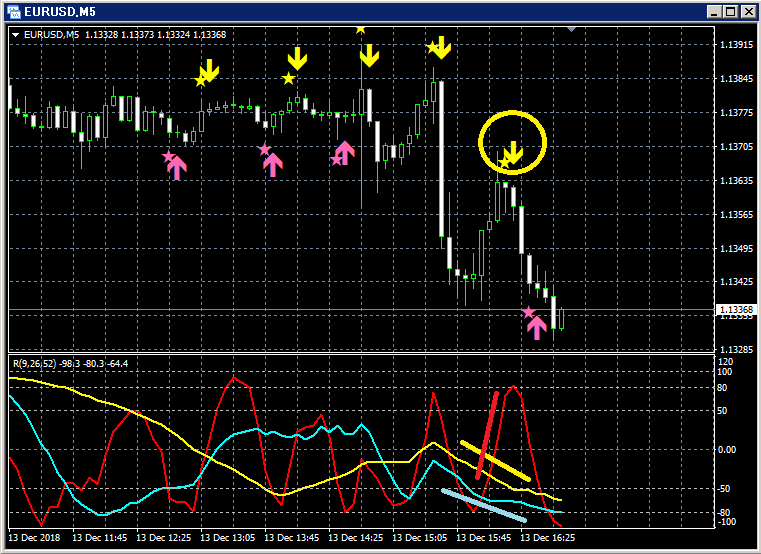
Upper row: mBDSR
Lower row: RCI three-line chart (red: RCI9, light blue: RCI26, yellow: RCI52)Only RCI9 among the three RCI lines is clearly rising.
If RCI9 reverses and falls, all three RCI lines may turn downward, indicating a possible strong price decline.
In other words, prices may fall sharply.
In such a situation, the mBDSR’s reversal sell signal (yellow arrows circled in the diagram) lights up.
Immediately after the signal lights, six consecutive bearish candles occur, indicating a steady price decline.
It is understood that.
Furthermore, the candlestick two bars before the reversal-down of the rising RCI9 confirms the reversal sell signal has lit.
This confirms the reversal sell signal at that point.
The BODSOR sales page is here.

Twitter
https://twitter.com/RCIX3Line
Blog
http://bodsor.blog.fc2.com/
Investment Navi Plus
https://fx-on.com/navi/serial/?id=359
YouTube
https://www.youtube.com/channel/UCL-g5uAlesiWVJEDtWlFvGw
Examples of push-up buying and pullback selling signals on USD/JPY 1-hour chart
※For ease of explanation, the chart in this article may include added circles, lines, and squares of yen as necessary, so please understand.


