

AUDUSD 30-minute chart Retracement selling signal [RCI 3-line + mBDSR]
※Campaign is ongoing until January 10, 2019.
The sales page for BODSOR (mBDSR) is here.
※ BODSOR is an indicator developed to improve entry accuracy when making buy-the-dalls on dips or sell-the-rallies using the RCI3-line.
Now, an extra indicator called 【mBDSR】 is bundled with 【BODSOR】.
【mBDSR】 (extra indicator):
The development concept is the same as for【BODSOR】, but the arrow signal generation conditions and its calculation method are completely different.
Because more arrow signals occur than with BODSOR, it increases the likelihood of capturing entry opportunities that could not be captured with BODSOR.
The figure below is an AUDUSD 30-minute chart.
AUDUSD 30-minute chart (December 13–14, 2018)
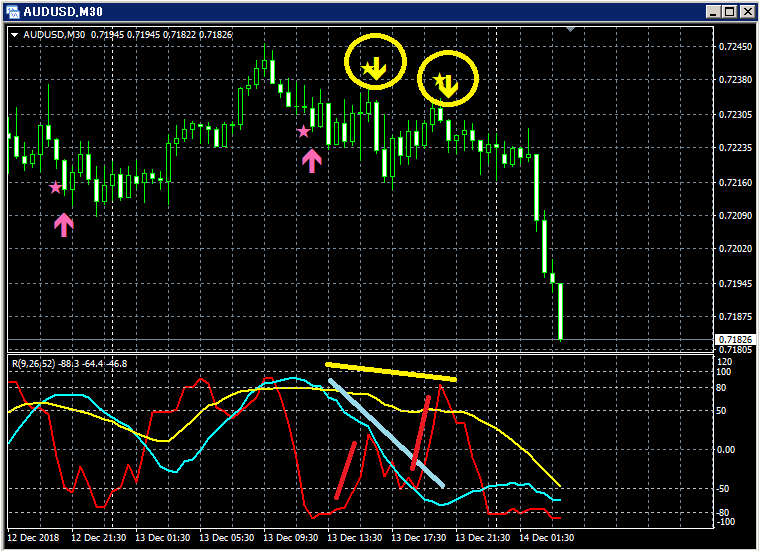
Upper tier: mBDSR
Among the three RCI lines, only RCI9 is clearly rising.
If RCI9 reverses and declines, all three RCI lines may decline together.
In other words, price could undergo a strong decline.
In such a scenario,mBDSR’s sell-the-rally signal (yellow arrows circled) lights up.
In the above example, two such sell-the-rally signals lit up, but in both cases the timing of the decline’s start appears to have been captured well.
BODSOR (mBDSR) sales page is here.

Twitter
https://twitter.com/RCIX3Line
Blog
http://bodsor.blog.fc2.com/
Invest Navi Plus
https://fx-on.com/navi/serial/?id=359
YouTube
https://www.youtube.com/channel/UCL-g5uAlesiWVJEDtWlFvGw
Example of buy-the-dip and sell-the-rally signals on the USD/JPY 1-hour chart
※For ease of explanation, some charts in this article may include additions such as yen marks, straight lines, or rectangles; please understand.


