

Euro Yen 30-minute Chart Retracement Sell Signal [RCI Three Lines + mBDSR]
※Campaign is ongoing until January 10, 2019.
The sales page for BODSOR (mBDSR) is here.
BODSOR is an indicator developed to increase the entry accuracy when using an up-thrust buying or pullback selling with three-line RCI3.
to improve entry accuracy.
This time, the BODSOR comes bundled with a bonus indicator 【mBDSR】.
【mBDSR】 (bonus indicator):
The development concept is the same as BODSOR, but the arrow signal generation conditions and calculation method are completely
different.
Because more arrow signals occur than with BODSOR, there is a higher possibility of catching entry opportunities that could not be captured with BODSOR.
The figure below is a 30-minute chart of the euro/yen.
EUR/JPY 30-minute chart (December 13, 2018)
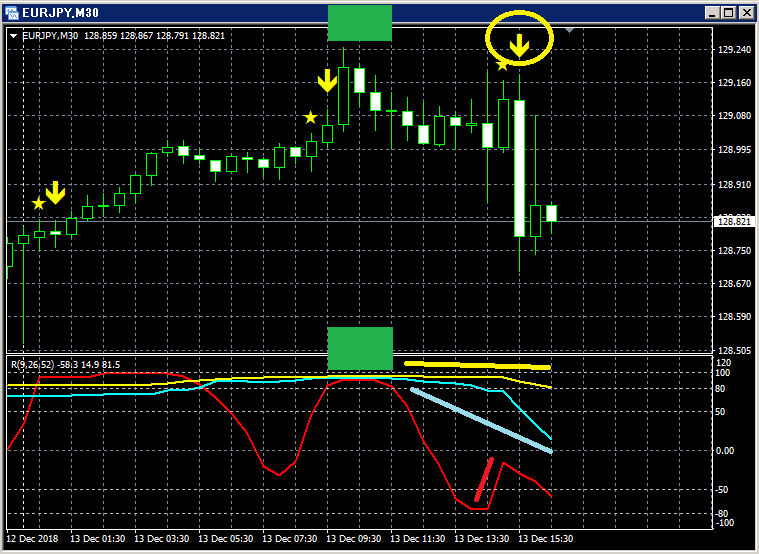
section:mBDSR
Among the three RCI lines, only RCI9 is clearly rising.
If RCI9 reverses and starts to fall, all three RCI lines may decline together.
In other words, the price could also fall strongly.
In such a situation,mBDSR's pullback sell signal (yellow arrows circled with a circle) lights up.
In this example, you can see that a very large bearish candle occurs immediately after the signal lights up.
A so-called RCI triple top (around the area shown by the green box) and then a pullback after RCI9
to resume sell signal is a very common pattern.
BODSOR (mBDSR) sales page is here.

Twitter
https://twitter.com/RCIX3Line
Blog
http://bodsor.blog.fc2.com/
Investment Navi+
https://fx-on.com/navi/serial/?id=359
YouTube
https://www.youtube.com/channel/UCL-g5uAlesiWVJEDtWlFvGw
USD/JPY 1-hour chart example of pullback buy and pullback sell signals
※In the charts in this article, for convenience, circles, lines and squares may be drawn and added, so please understand.
Please note.


