

Example of a trend reversal from the sign of "RCI3 Three-Line + mBDSR" (GBP/USD 5-minute chart)
0
※Campaign is ongoing until January 10, 2019.
BODSOR (mBDSR)sales page ishere.
※ BODSOR and mBDSR are indicators developed to improve the entry accuracy when using three-line RCIs for pullback buying or pullback selling.
The figure below is the 5-minute chart of GBP/USD.
GBP/USD 5-minute chart (December 13, 2018)
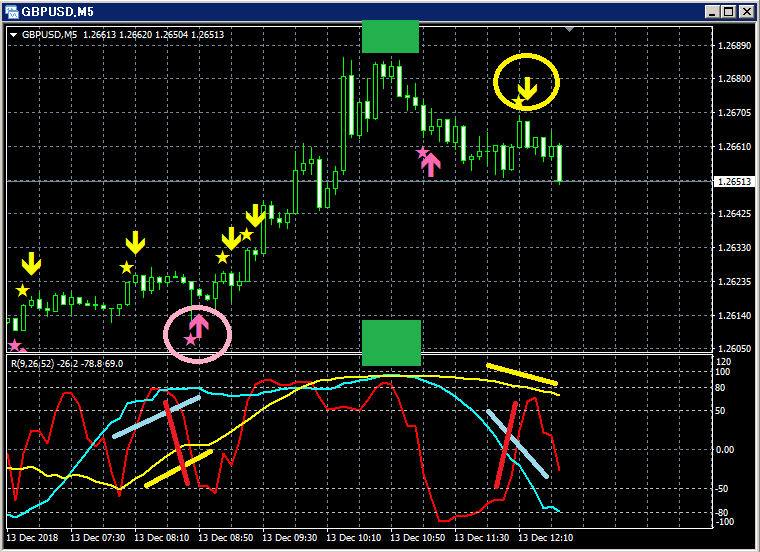
Top: mBDSR
Bottom: RCI three-line chart (red: RCI9, light blue: RCI26, yellow: RCI52)
(1) Buy on dips signal
Among the three RCI lines, only RCI9 is clearly declining.
If RCI9 reverses upward, all three RCIs may rise together.
In other words, price may also rise strongly.
In such a scenario,mBDSR’s buy-on-dips signal (pink arrow encircled) lights up.
Immediately after the signal lights, two small bearish candles appear in succession, but the price retracement is contained within 10 pips, and then it continues rising smoothly.
(2) Rise to the so-called “RCI triple top”
After rising to the formation known as the “RCI triple top,” the price falls.
(3) Sell on rallies signal
Among the three RCI lines, only RCI9 is clearly rising.
If RCI9 reverses downward, all three RCIs may fall together.
In other words, price may fall strongly.
In such a scenario,mBDSR’s sell-on-rallies signal (yellow arrow encircled) lights up.
Right after the signal lights, a candle without a upper shadow occurs, and price moves down without retracing, making new lows
lower remains evident.
For the above sell-on-rallies signal, it is a very common pattern to chase the retrace after RCI triple top and then RCI9 dips once.
This is a highly typical pattern.

Twitter
https://twitter.com/RCIX3Line
Blog
http://bodsor.blog.fc2.com/
Investment Navigation Plus
https://fx-on.com/navi/serial/?id=359
YouTube
https://www.youtube.com/channel/UCL-g5uAlesiWVJEDtWlFvGw
Examples of buy-on-dips and sell-on-rallies on GBP/JPY 1-hour chart
※In some charts within this article, for convenience of explanation, circles, lines, and squares may be drawn, so please understand.
× ![]()


