

【RCI3 single line plus mBDSR】EUR/USD 1-hour chart example of a pullback buying signal
※Campaign is ongoing until January 10, 2019.
The BODSOR sales page ishere.
BODSOR is an indicator developed to increase entry accuracy when performing buy-the-dips or selling on pullbacks using three RCI lines.
This time, a bonus indicator 【mBDSR】 has been included with【BODSOR】.
【mBDSR】 (Bonus Indicator):
The development concept is the same as for 【BODSOR】, but the arrow sign generation conditions and the calculation method are completely
different.
Because more arrow signs occur than with 【BODSOR】, there is a higher possibility of capturing entry opportunities that could not be caught with 【BODSOR】.
The figure below is the EUR/USD 1-hour chart.
EUR/USD 1-hour chart
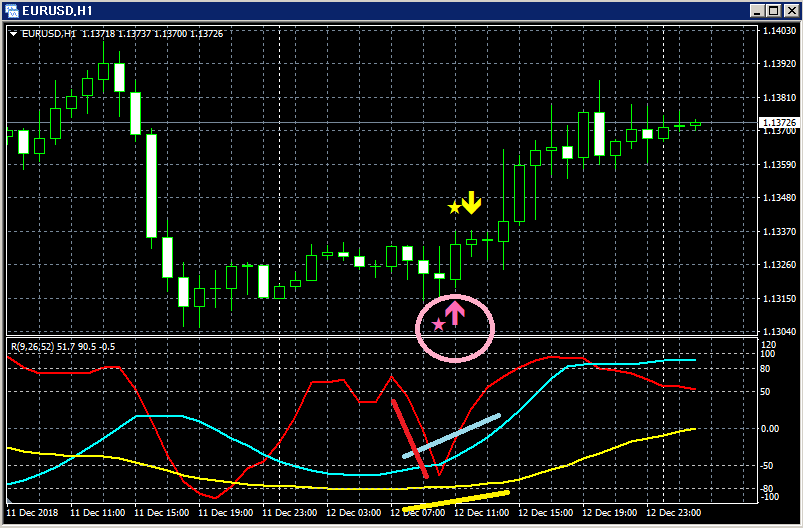
Top: mBDSR
Bottom: RCI three-line (Red: RCI9, Light blue: RCI26, Yellow: RCI52)
Of the three RCI lines, only RCI9 is clearly descending.
If RCI9 turns upward, all three RCIs may rise together.
In other words, the price may rise strongly.
In such a situation,mBDSR’s buy-the-dip signal (pink arrow circled) lights up.
Immediately after the signal lights, a solid bullish candle forms, and thereafter the low of the candle on which the signal lit
has not been broken.
The price retracement stays within a few pips, and it has risen by about 65 pips at one point.
The BODSOR sales page ishere.

Twitter
https://twitter.com/RCIX3Line
Blog
http://bodsor.blog.fc2.com/
Investment Navigation+
https://fx-on.com/navi/serial/?id=359
YouTube
https://www.youtube.com/channel/UCL-g5uAlesiWVJEDtWlFvGw
USD/JPY 1-hour chart: examples of buy-the-dip and sell-on-rallies signals
※In charts within this article, for convenience of explanation, please note that there may be annotations such as circles, lines, and rectangles drawn.
Please understand.
× ![]()


