

【RCI3 single line + mBDSR】NZDUSD 5-minute chart Pullback sell signal 20181212
※Campaign is ongoing until January 10, 2019.
The sales page for BODSOR (mBDSR) is here.
BODSOR is an indicator developed to improve the entry accuracy when using three-line RCI (RCI3) for buy-the-dear dips or sell-the-rallies.
This time, a bonus indicator 【mBDSR】 was added to 【BODSOR】.
【mBDSR】 (bonus indicator):
The development concept is the same as 【BODSOR】, but the arrow signal generation conditions and their calculation method are completely different.
Since more arrow signals occur than with 【BODSOR】, there is a higher possibility of capturing entry opportunities that 【BODSOR】 could not catch.
First, here is the NZDUSD 5-minute chart.
NZDUSD 5-minute chart (December 12, 2018)
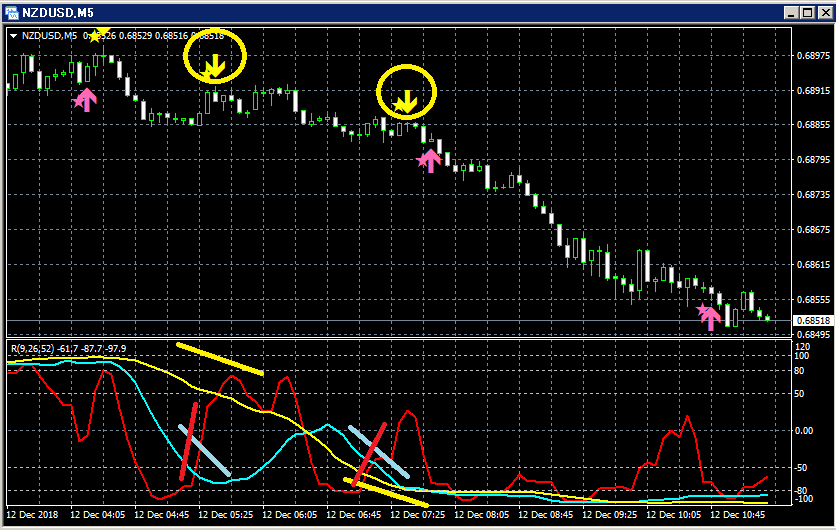
Top: mBDSR
Of the three RCI lines, only RCI9 is clearly rising.
If RCI9 turns downward, all three RCI lines may turn downward.
In other words, price may also fall sharply.
In such a situation, the return-sell signal of lights up (yellow arrows circled).
In the above chart, there are two return-sell signals shown, but especially after the second signal lights up, the price has

Twitter
https://twitter.com/RCIX3Line
Blog
http://bodsor.blog.fc2.com/
Investment Navi+
https://fx-on.com/navi/serial/?id=359
YouTube
https://www.youtube.com/channel/UCL-g5uAlesiWVJEDtWlFvGw
USD/JPY 1-hour chart: example of pullback buying and return-selling signals
※In the charts within this article, for ease of explanation, circles, straight lines, and squares may have been added, so please understand.


