

【RCI3 Three-Line+mBDSR】POUND DOLLAR 5-minute chart & 1-minute chart Rebound Sell Signal 20181211
※Campaign ongoing until January 10, 2019.
BODSOR sales page is here.
BODSOR is an indicator developed to improve entry precision when performing buy-the-dips or selling during pullbacks using the RCI three-line setup.
This time, a bonus indicator 【mBDSR】 has been included with【BODSOR】.
【mBDSR】 (bonus indicator):
The development concept is the same as【BODSOR】, but the arrow signal generation conditions and its calculation method are completely different.
Since more arrow signals occur than with【BODSOR】, there is a higher possibility of catching entry opportunities that could not be captured with【BODSOR】.
First, here is the GBP/USD 5-minute chart.
GBP/USD 5-minute chart (December 11, 2018)
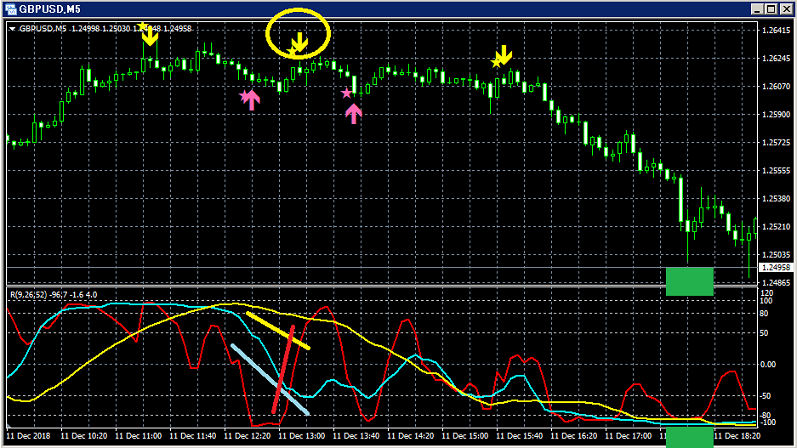
Upper: mBDSR
Among the three RCI lines, only RCI9 is clearly rising.
If RCI9 turns down, all three RCI lines may turn down together.
In other words, the price may undergo a strong decline.
In such a situation, the mBDSR pullback/sell signal (yellow arrows encircled) lights up.
After the signal lights, the price retrace stays within about 10 pips. After that, the price
Next is the GBP/USD 1-minute chart.
GBP/USD 1-minute chart (December 11, 2018)
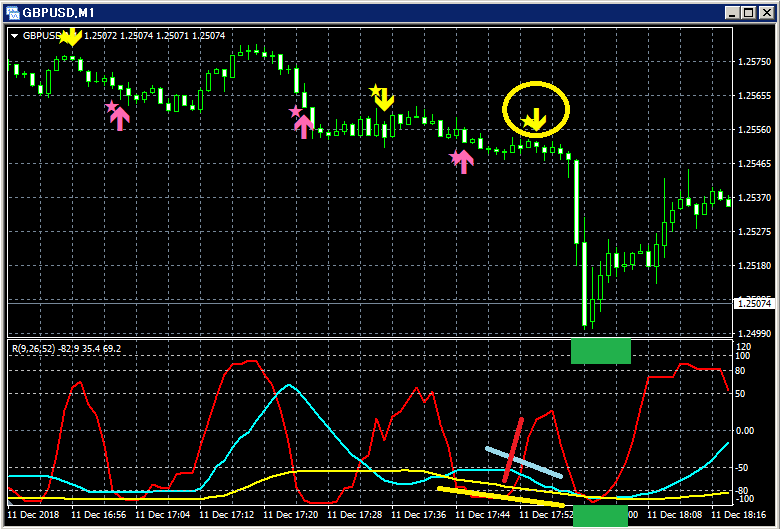
Upper: mBDSR
BODSOR sales page is here.

Twitter
https://twitter.com/RCIX3Line
Blog
http://bodsor.blog.fc2.com/
Investment Navigator+
https://fx-on.com/navi/serial/?id=359
YouTube
https://www.youtube.com/channel/UCL-g5uAlesiWVJEDtWlFvGw
USD/JPY 1-hour Chart Example of Buy-the-dip and Sell-the-rally Signals
※Please note that in charts within this article, for convenience of explanation, there may be additions such as currency marks, straight lines, or rectangles.
Thank you for understanding.


