
【MT5】Over multiple timeframes, mBDSR (RCI2 two-filter) selling signal on the pullback (note the pullback high on higher timeframe)
【Mastering RCI!! Trend Reversal, Buy on Dips, Sell on Rallies】
Indicator that shines in combination with RCI【BODSOR・mBDSR】
and methods & case studies (PDF) ★GogoJungle AWARD2020 winner★
https://www.gogojungle.co.jp/tools/indicators/11836
The PDF file includes 358 items (over 1,400 pages, over 470,000 characters).
At the beginning of this year, the MT5 version (Beta) was released!!
mBDSR (Product ID 11836) Purchase Bonus】MT5 version of the indicator (beta)
“mBDSR (without filter, RCI filter, MA filter)”
https://www.gogojungle.co.jp/tools/indicators/56765
To make even better use of the MT5 version of mBDSR, we have added 52 more PDFs (over 180 pages, over 170 chart pages, over 70,000 characters in total).
MT5includes12-minute chartas standard.
USD/JPY 4-hour chart
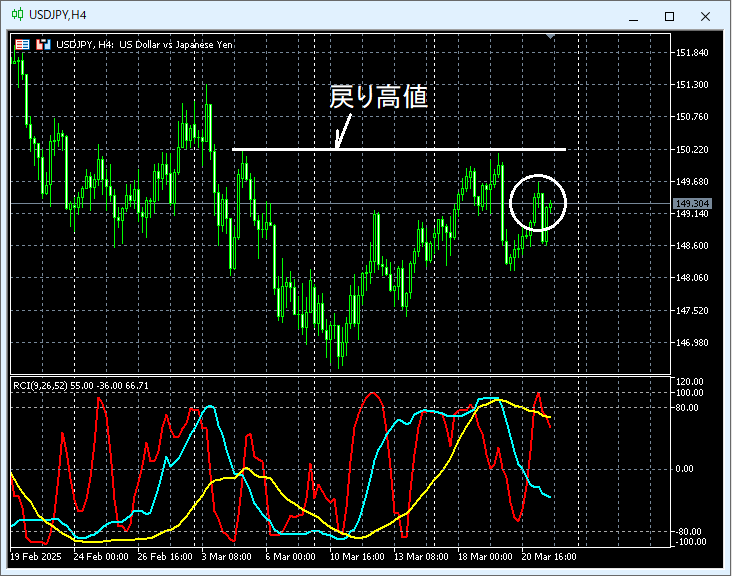
The higher-timeframe view is omitted. It’s a trend where the price cannot break above the rally high at the 4-hour level. Consider selling on rallies around the area circled in white.
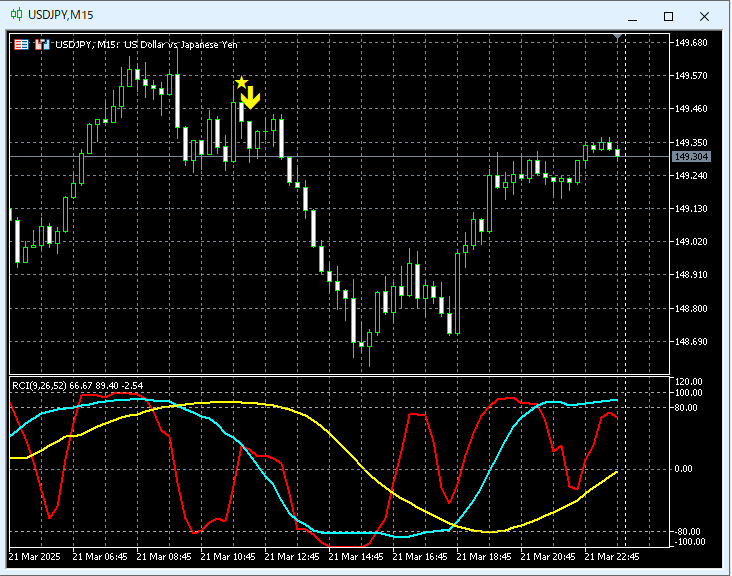
USD/JPY 15-minute chart
USD/JPY 12-minute chart

In order of 12-minute chart, 15-minute chartmBDSR (Two RCI filters) Sell-on-Rally signallights up, and the price declines steadily.
Although abbreviated here, in this case,RCI3-lineis used to drop down from the 4-hour chart to lower timeframes sequentially,mBDSR (Two RCI filters) Sell-on-Rally signalis carried to a state where we wait for it. The explanation of the method of dropping from higher to lower timeframes is in the accompanying PDF.
From this example,a trading method that focuses on retracement highs (Dow Theory) and RCI3-lineandthe harmony with mBDSR signalsis evident.
※Please note that charts shown in this article may have added circles, lines, rectangles, etc. for readability.
Indicator that shines in combination with RCI【BODSOR・mBDSR】
and methods & case studies (PDF) ★GogoJungle AWARD2020 winner★
https://www.gogojungle.co.jp/tools/indicators/11836
The PDF file includes 358 items (over 1,400 pages, over 470,000 characters).
Most of them are compiled as examples that use the RCI3-line to logically link higher and lower timeframes, sequentially analyze the状況 of multiple lower timeframes, and ultimately drop into a state where you wait for the pullback buy or rally sell signals on the lower timeframes (i.e., mBDSR signals).
Furthermore,many of them focus on identifying points where multiple entry reasons overlap.There are also many that include.
Additionally,there are methods for exploring upside targets or downside targets using RCI3-lineas well.
In the PDF explanations,more than 1,350 chartsare used.
