

【RCI3 Three-Line+mBDSR】 Pound-Dollar 30-Minute Chart Example of Retracement Sell Signal
※Campaign is ongoing until January 10, 2019.
The sales page for BODSOR (mBDSR) is here.
BODSOR is an indicator developed to improve entry accuracy when using the three-line RCI to perform breakout buying on dips or selling on rebounds.
This time, a bonus indicator【mBDSR】 has been included with 【BODSOR】.
【mBDSR】(Bonus Indicator):
Its development concept is the same as 【BODSOR】, but its arrow signal generation conditions and calculation method are completely different.
Because more arrow signals are generated than 【BODSOR】, there is a higher likelihood of capturing entry opportunities that could not be captured with 【BODSOR】.
The figure below is a 30-minute chart of GBP/USD.
GBP/USD 30-minute chart (December 11–12, 2018)
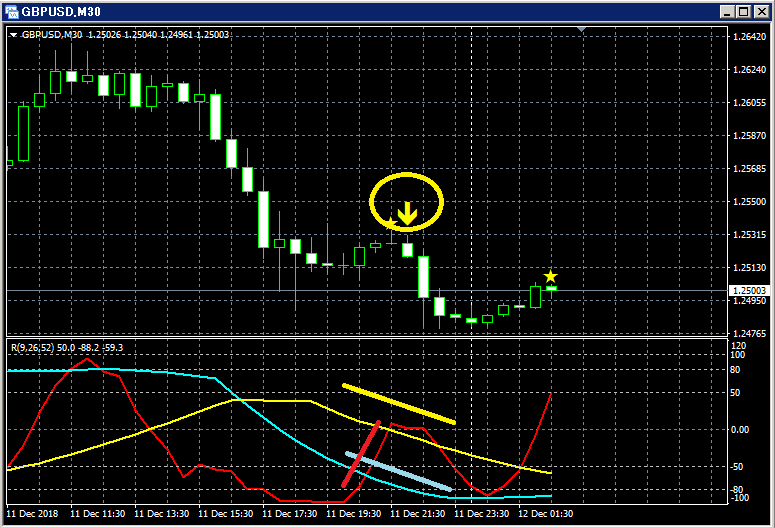
Upper section:mBDSR
Among the three RCI lines, only RCI9 is clearly rising.
If RCI9 reverses downward, all three RCI lines may turn downward, signaling a potential strong price drop.
In other words, price may experience a strong decline.
In such a situation,mBDSR’s rebound-sell signal (yellow arrows circled) lights up.
Immediately after the signal lights up, five consecutive bearish candles appear, and the price declines smoothly.
Sale page for BODSOR (mBDSR) is here.

Twitter
https://twitter.com/RCIX3Line
Blog
http://bodsor.blog.fc2.com/
Investment Navi+
https://fx-on.com/navi/serial/?id=359
YouTube
https://www.youtube.com/channel/UCL-g5uAlesiWVJEDtWlFvGw
Example of buy-the-dip and sell-the-rally signals on USD/JPY 1-hour chart
※Please note that in charts within this article, for convenience of explanation, circles, lines, and squares may be drawn, so please understand.
、


