

【RCI3 Main Line + mBDSR】 Pound-Dollar 30-Minute Chart Example of a Buy-the-Dip Signal
0
※Campaign is ongoing until January 10, 2019.
The BODSOR sales page ishere.
※ BODSOR is an indicator developed to improve the entry accuracy when buying on dips and selling on rallies using the RCI three-line setup.
This time, an extra indicator 【mBDSR】 has been bundled with 【BODSOR】.
【mBDSR】 (Bonus indicator):
The development concept is the same as 【BODSOR】, but the conditions for generating arrow signals and its calculation method are completely different.
Because more arrow signals are generated than with 【BODSOR】, it is more likely to capture entry opportunities that 【BODSOR】 could not.
The figure below is a 30-minute chart of the GBPUSD.
GBPUSD 30-minute chart
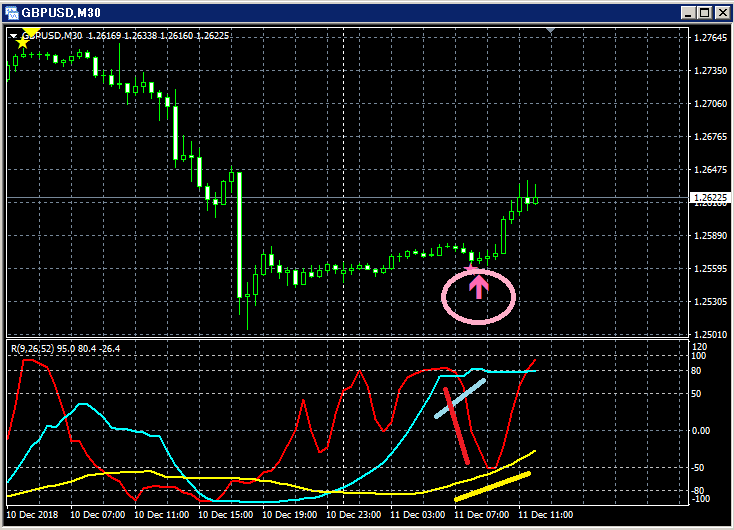
Upper row:mBDSR
Lower row: RCI three lines (red: RCI9, light blue: RCI26, yellow: RCI52)
Among the three RCI lines, only RCI9 is clearly declining.
If RCI9 reverses and rises, all three RCIs may rise together.
In other words, price may rise strongly as well.
In such a scenario,mBDSR dip-buy signal (pink arrow encircled) lights up.
Immediately after the signal lights, six bullish candles occur in succession, indicating the price is rising smoothly.
It is evident.
Note that the reversal ascent of the declining RCI9 is confirmed after four bullish candles have formed.
The BODSOR sales page ishere.

Twitter
https://twitter.com/RCIX3Line
Blog
http://bodsor.blog.fc2.com/
Investment Navigator+
https://fx-on.com/navi/serial/?id=359
YouTube
https://www.youtube.com/channel/UCL-g5uAlesiWVJEDtWlFvGw
Examples of buy-on-dips and sell-on-rallies on USD/JPY 1-hour chart
※ In the charts in this article, for ease of explanation, circles, straight lines, and squares may be drawn.
Please understand.
× ![]()


