

Example of a trend reversal from the sign of "RCI3 single line + mBDSR" (EUR/USD 30-minute chart)
※Campaign is valid until January 10, 2019.
The BODSOR sales page ishere.
※ BODSOR is an indicator developed to improve entry accuracy when performing pullback selling or pullback buying using three RCI lines.
This time, an accompanying indicator 【mBDSR】 has been included with 【BODSOR】.
【mBDSR】 (accompanying indicator):
The development concept is the same as for 【BODSOR】, but the arrow signal generation conditions and the calculation method are completely different.
Compared to 【BODSOR】, more arrow signals are generated, increasing the likelihood of capturing entry opportunities that could not be captured with 【BODSOR】.
The figure below is a 30-minute chart of EUR/USD.
EUR/USD 30-minute chart
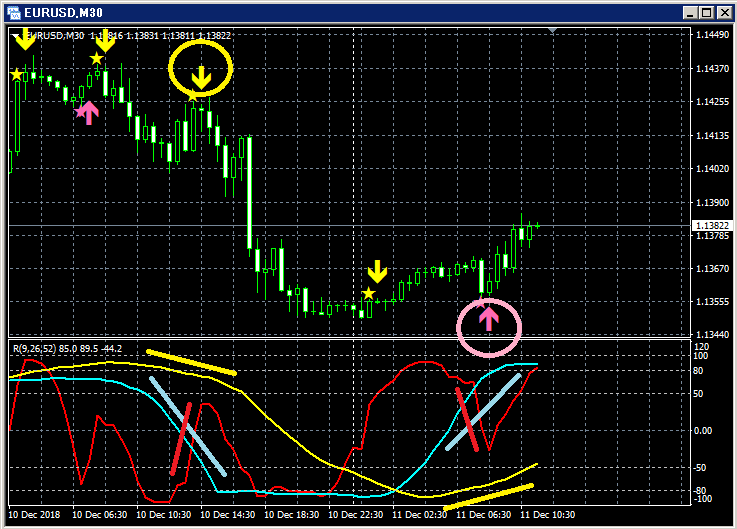
Top row:mBDSR
Bottom row: RCI3-line (red: RCI9, light blue: RCI26, yellow: RCI52)
(1) Reversal selling signal
Among the three RCI lines, only RCI9 is clearly turning upward.
If RCI9 turns down, all three RCI lines may turn downward, indicating a potential strong price decline.
That is, there is a high possibility of strong price decline.
In such a scenario,mBDSR’s reversal selling signal (yellow arrow circled) lights up.
Immediately after the signal lights, four consecutive large bearish candles occur, and subsequently, the price drops sharply.
This can be observed.
Note that the reversal of the rising RCI9 is confirmed after three bearish candles appear.
(2) Pullback buying signal
Among the three RCI lines, only RCI9 is clearly turning downward.
If RCI9 turns upward, all three RCI lines may turn upward, indicating a potential strong price rise.
That is, there is a high possibility of strong price rise.
In such a scenario,mBDSR’s pullback buying signal (pink arrow circled) lights up several times.
and it.
Immediately after the signal lights, two consecutive bullish candles occur and the price rises. It is clear that.
Note: The reversal of the falling RCI9 upward is confirmed after two bullish candles appear.

Twitter
https://twitter.com/RCIX3Line
Blog
http://bodsor.blog.fc2.com/
Investment Navi+
https://fx-on.com/navi/serial/?id=359
YouTube
https://www.youtube.com/channel/UCL-g5uAlesiWVJEDtWlFvGw
Examples of pullback buying and reversal selling signals on USD/JPY, 1-hour chart
※In the charts in this article, for ease of explanation, circles, straight lines, and squares may have been added, so please understand.
Please note.
× ![]()


