

Pattern to lower from RCI3 threefold ceiling to threefold bottom [RCI3 three-line + mBDSR]
Campaign is ongoing until January 10, 2019.
BODSOR (mBDSR)sales pagehere.
※ BODSOR and mBDSR are indicators developed to improve entry accuracy when using the RCi3-line for introductory buying on dips and selling on retracements.
They are designed to enhance entry precision for such strategies.
The figure below shows the EURAUD 30-minute chart.
EURAUD 30-minute chart
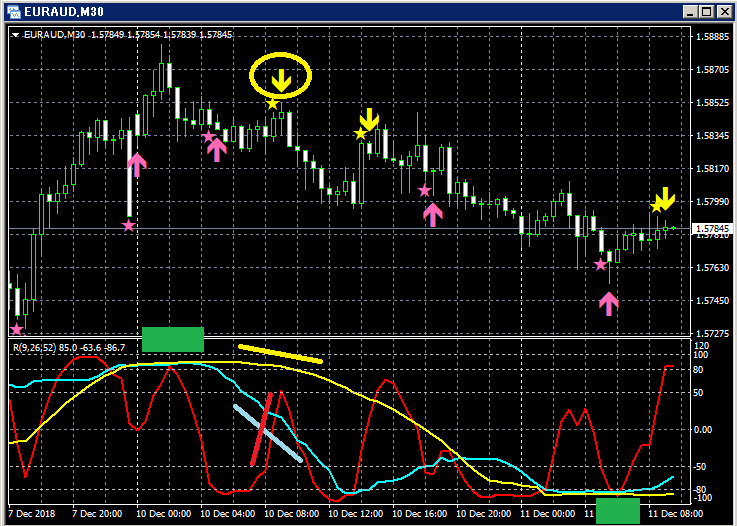
Top: mBDSR
Among the three RCI lines, only RCI9 is clearly rising.
If RCI9 turns downward, all three RCI lines may decline.
In other words, the price may undergo a strong decline.
In such a scenario,mBDSR’s retracement sell signal (yellow arrow encircled) lights up.
Immediately after the signal lights, there is a small bullish candle, but the counter-move is within 10 pips. After that, six consecutive bearish candles appear.
This is a common pattern where the price retraces after the so-called “RCI triple top” and then tests the short-term RCI9 line of the three RCI lines.
Later, the price declines to the so-called “RCI triple bottom.”
For reference, as shown below, on this day the 1-hour chart also lights up a retracement sell signal for the combination of “RCI three lines + mBDSR.”
EURAUD 1-hour chart
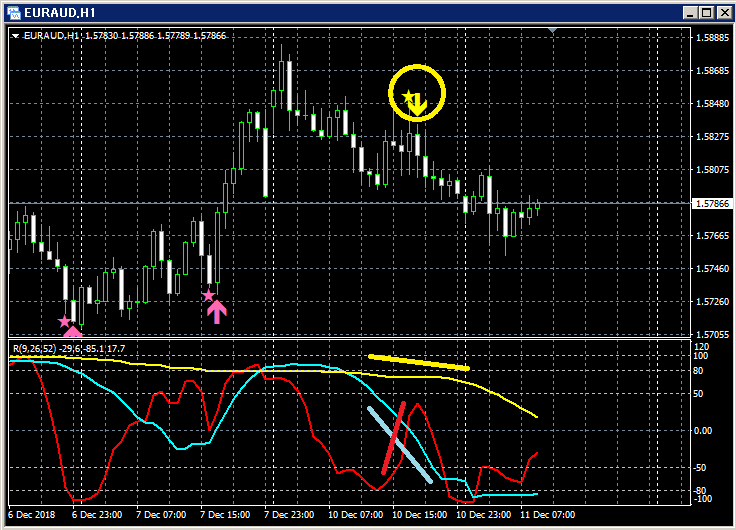
Top: mBDSR
Bottom: RCI three-line indicator (red: RCI9, light blue: RCI26, yellow: RCI52)
After the signal lights, four bearish candles appear consecutively.
The reversal of the rising RCI9 is confirmed after two bearish candles appear.
BODSOR (mBDSR) sales page is here.

Twitter
https://twitter.com/RCIX3Line
Blog
http://bodsor.blog.fc2.com/
Investment Navigator Plus
https://fx-on.com/navi/serial/?id=359
YouTube
https://www.youtube.com/channel/UCL-g5uAlesiWVJEDtWlFvGw
Example of pullback buy and retracement sell signals on USD/JPY 1-hour chart
※ In the charts in this article, for convenience of explanation, you may see additions of circles, lines, and rectangles that are not part of the original chart, so please understand.


