

【RCI3本ライン+mBDSR】Dollar/Yen 30-minute chart example of a pullback buy signal
0
Campaign is ongoing until January 10, 2019.
BODSOR sales page ishere.
BODSOR is an indicator developed to improve the entry accuracy when using three RCI lines to perform pullbacks buys and pullbacks sales.This time, a free accessory indicator mBDSR has been included with 【BODSOR】.
mBDSR
【mBDSR】 (free accessory indicator):
The development concept is the same as 【BODSOR】, but the arrow signal generation conditions and its calculation method are completely different.
Compared to 【BODSOR】, more arrow signals occur, increasing the likelihood of catching entry opportunities that could not be captured by 【BODSOR】.
The figure below is the USD/JPY 30-minute chart.
USD/JPY 30-minute chart
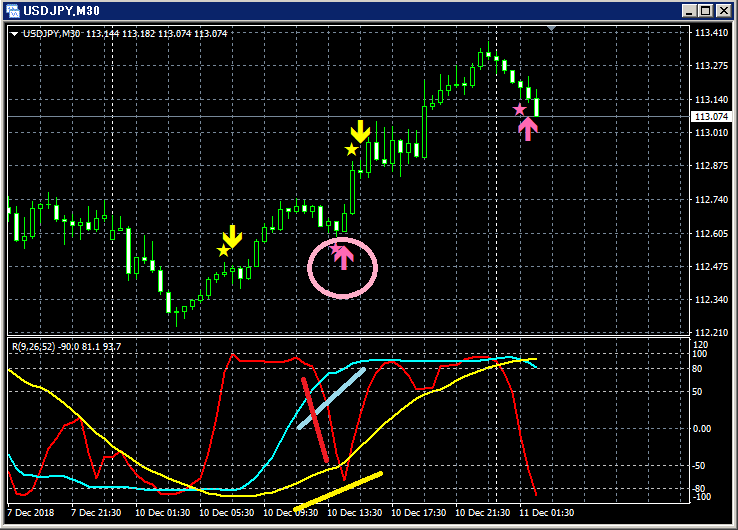
Top row:mBDSR
Bottom: RCI three lines (red: RCI9, light blue: RCI26, yellow: RCI52)
Of the three RCI lines, only RCI9 is clearly declining.
If RCI9 reverses and rises, there is a possibility that all three RCIs rise together.
In other words, the price may rise strongly.
In such a situation,mBDSR’s pullback buy signal (pink arrows enclosed in circles) lights up.
Immediately after the signal lights, two solid bullish candles form in succession, and thereafter the price continues to
rise steadily upward.
Note that the reversal ascension of the declining RCI9 is confirmed after two bullish candles have formed.
BODSOR sales page ishere.

Twitter
https://twitter.com/RCIX3Line
Blog
http://bodsor.blog.fc2.com/
Investment Navi+
https://fx-on.com/navi/serial/?id=359
YouTube
https://www.youtube.com/channel/UCL-g5uAlesiWVJEDtWlFvGw
Example of pullback buying and pullback selling signals on USD/JPY 1-hour chart
※In the charts in this article, for convenience of explanation, please note that lines, squares, circles, etc. may be drawn in.
We appreciate your understanding.
× ![]()


