

【Master RCI to Win!!】Buy signal on pullbacks for resistance/support reversal, trend reversal, and mBDSR.
0
【Master RCI to Win Extremely!! Trend Reversal – Buying on Dips – Selling on Rallies】
Indicator that synergizes powerfully with RCI【BODSOR・mBDSR】
and methods, case studies (PDF) ★GogoJungle AWARD2020 winner★
https://www.gogojungle.co.jp/tools/indicators/11836
The PDF file includes 358 items (over 1,400 pages, over 470,000 characters in total).
March 25, 2025 USD/JPY 5-minute chart +55 pips

At the beginning of this year, the 【MT5 Version – Beta】 was released!!
mBDSR (Product ID 11836) Purchase Bonus】 MT5 version of the indicator (Beta)
“mBDSR (no filter, RCI filter, MA filter)”
https://www.gogojungle.co.jp/tools/indicators/56765
To help you utilize the MT5 version of mBDSR more effectively, an additional 52 PDFs (over 180 pages, over 170 charts, over 70,000 characters in total) have been added.
MT5 includes4-minute chart as standard.
USDJPY – 30-minute chart (left) and 4-minute chart (right)
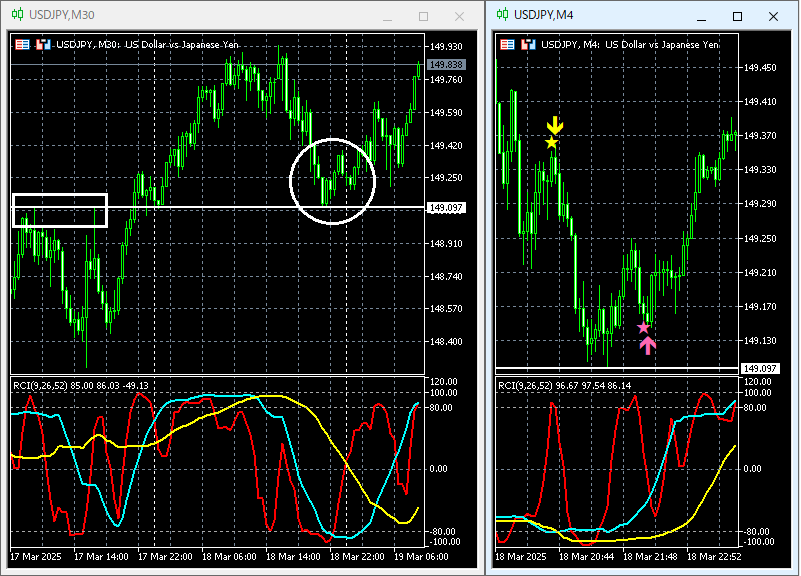
From the upper-left 30-minute chart, in the area circled in white,Support/Resistance Reversal has risen.
Looking at the upper-right 4-minute chart,mBDSR (2-filter of RCI) Sell signal lights up, first pulling down to the past resistance line on the higher timeframe. Then after the rebound,mBDSR (2-filter of RCI) Buy-the-dip signal lights up, and price rises steadily right after that.
From this example,the synergy between a trade method focused on Support/Resistance Reversal andthe signals of mBDSR is evident.
※Please note that the charts in this article may include added circles, lines, or rectangles for explanatory convenience.
Indicator that shines when combined with RCI【BODSOR・mBDSR】
and methods, case studies (PDF) ★GogoJungle AWARD2020 winner★
https://www.gogojungle.co.jp/tools/indicators/11836
The PDF file includes 358 items (over 1,400 pages, over 470,000 characters in total).
Many of them explain how to logically link the higher and lower timeframes using three RCI lines, and ultimately break down to the lower-timeframe timing for buying on dips or selling on rallies (i.e., waiting for mBDSR signals).
In addition,many focus on capturing points where multiple entry reasons overlap.There are also many that explore methods using three RCI lines to identify upward or downward targets.
In the descriptions within the PDF files,over 1,350 charts are used.
.

× ![]()


