

EuroDollar 30-minute chart Retracement Sell Signal 【RCI three-line + mBDSR】
Campaign is ongoing until January 10, 2019.
The BODSOR sales page is here.
BODSOR is an indicator developed to improve entry accuracy when using a three-line RCI for buying on pullbacks or selling on rallies.
to improve entry accuracy when using the three-line RCI for buying on pullbacks or selling on rallies.
This time, an accessory indicator 【mBDSR】 has been included with 【BODSOR】.
【mBDSR】 (Accessory Indicator):
Its development concept is the same as 【BODSOR】, but the arrow signal generation conditions and its calculation method are entirely different.
Because more arrow signals occur than with 【BODSOR】, there is a higher likelihood of capturing entry opportunities that could not be captured with 【BODSOR】.
The figure below is a 30-minute chart of the EUR/USD.
EUR/USD 30-minute chart (as of December 10, 2018)
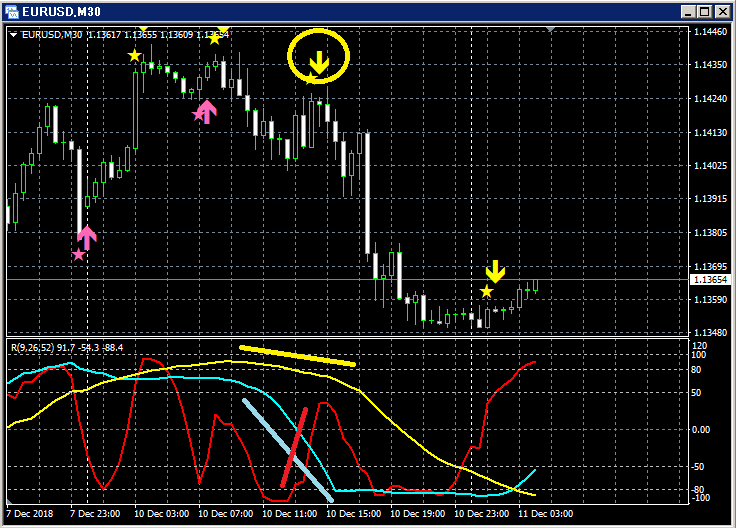
Top row: mBDSR
Among the three RCI lines, only RCI9 is clearly rising.
If RCI9 reverses downward, all three RCI lines may move downward.
That is, the price may also undergo a strong decline.
In such a situation, mBDSR pullback/sell signal (yellow arrows circled) lights up.
Immediately after the signal lights, four bearish candles occur in succession, and prices continue to fall afterward.
This indicates thatthe price is declining steadily.
Note that the reversal of the rising RCI9 is confirmed after three bearish candles appear.
The BODSOR sales page is here.

Twitter
https://twitter.com/RCIX3Line
Blog
http://bodsor.blog.fc2.com/
Investment Navi+
https://fx-on.com/navi/serial/?id=359
YouTube
https://www.youtube.com/channel/UCL-g5uAlesiWVJEDtWlFvGw
Examples of buy on dips and sell on rallies signals for USD/JPY on the 1-hour chart
※In the charts within this article, for convenience of explanation, circles, straight lines, and rectangles may be drawn, so please understand.
Please note.


