
【MT5】Daily chart level surge followed by multiple timeframes mBDSR (RCI2-band filter) short signal
【Mastering RCI!! Trend Reversal, Pullback Buy, and Retracement Sell】
An indicator that shines when used in combination with RCI: 【BODSOR・mBDSR】
and method and case studies (PDF) ★GogoJungle AWARD 2020 winner★
https://www.gogojungle.co.jp/tools/indicators/11836
The PDF file includes 358 items (over 1,400 pages, over 470,000 characters in total).
At the beginning of this year, the MT5 version beta was released!!
mBDSR (Product ID 11836) Purchase Bonus】MT5 version indicator (beta)
“mBDSR (no filter, RCI filter, MA filter)”
https://www.gogojungle.co.jp/tools/indicators/56765
To make even more effective use of the MT5 version of mBDSR, an additional 52 PDFs (over 180 pages, over 170 charts, over 70,000 characters in total) have been added.
MT5 provides2-hour chart and3-hour chart as standard.
EURNZD Daily

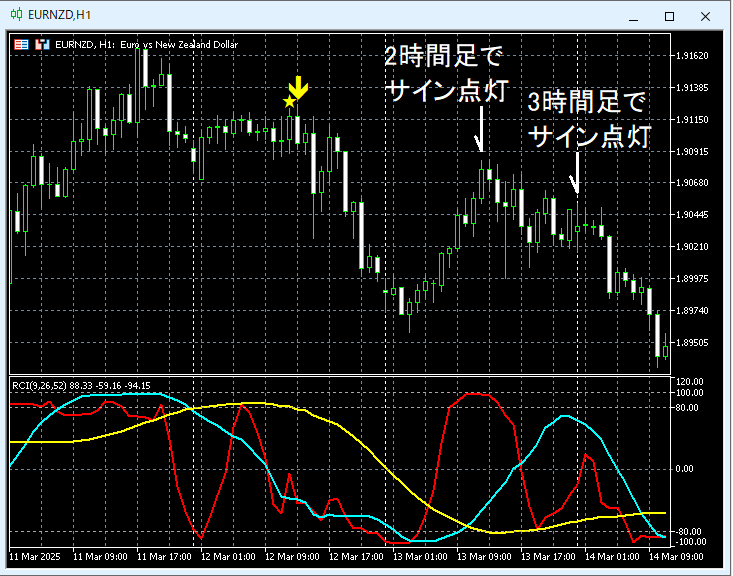
EURNZD 1-hour
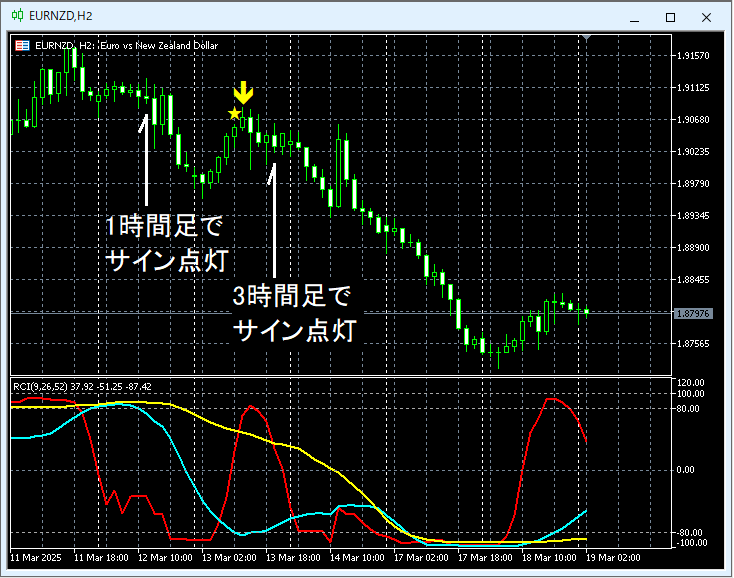
EURNZD 2-hour
EURNZD 3-hour
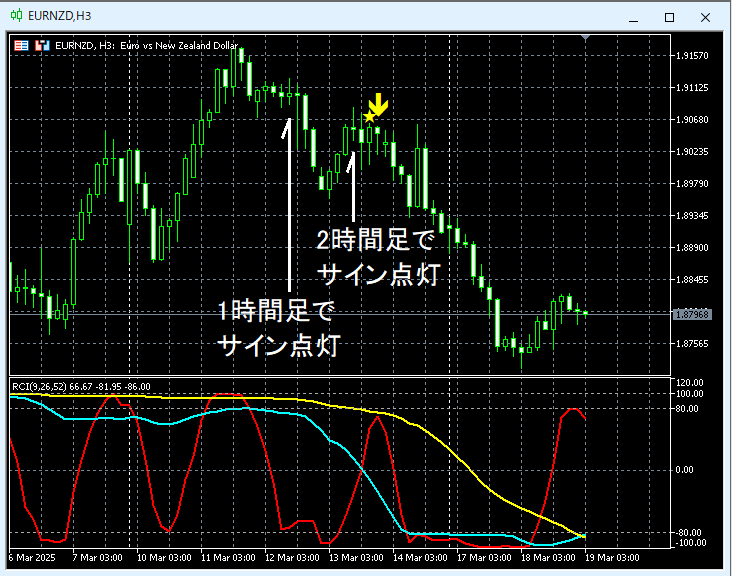
After a sharp rise on the daily chart, the signals align from the 1-hour, 2-hour, and 3-hour chartsmBDSR (RCI two-filter) retracement sell signallights up, and the price declines firmly.
In this case,RCI three-lineis used to drill down from daily to lower timeframes,mBDSR (RCI two-filter) retracement sell signalis brought into a setup waiting for it, but the explanation of that method is left to the accompanying PDF.
From this example,a trading method focusing on the RCI three-lineandthe signals of mBDSRshow strong compatibility.
※Please note that in the charts mentioned in this article, circles, lines, and rectangles may be added for clarity.
An indicator that shines when used in combination with RCI【BODSOR・mBDSR】
and method and case studies (PDF) ★GogoJungle AWARD 2020 winner★
https://www.gogojungle.co.jp/tools/indicators/11836
The PDF file includes 358 items (over 1,400 pages, over 470,000 characters in total).
Most of them are summarized as follows: by using the RCI three-line to logically link the higher and lower timeframes, examining the conditions of multiple lower timeframes sequentially, and ultimately waiting for the timing of a pullback buy or retracement sell on the lower timeframe (i.e., the signal of mBDSR).there are many that emphasize catching points where multiple entry reasons overlap.Additionally,
.
Also included is a method for exploring upside targets or downside targets using the RCI three-line.
In the PDF explanations,more than 1,350 charts are used..
