

Pound-Dollar 15-Minute Chart Rebound Sell Signal [RCI 3-Line + mBDSR]
Campaign is ongoing until January 10, 2019.
BODSOR sales page ishere.
BODSOR is an indicator developed to improve the entry accuracy when buying on dips or selling on rallies using the RCI three-line setup.
The purpose is to enhance precision for entries in such situations.
Recently, an accompanying indicator mBDSR has been included with 【BODSOR】.
【mBDSR】 (the included bonus indicator):
Its development concept is the same as 【BODSOR】, but the arrow signal conditions and its calculation method are completely different.
Because more arrow signals occur than with 【BODSOR】, there is a higher possibility of capturing entry opportunities that could not be caught with 【BODSOR】.
The figure below is a 15-minute chart of the GBP/USD.
GBP/USD 15-minute chart
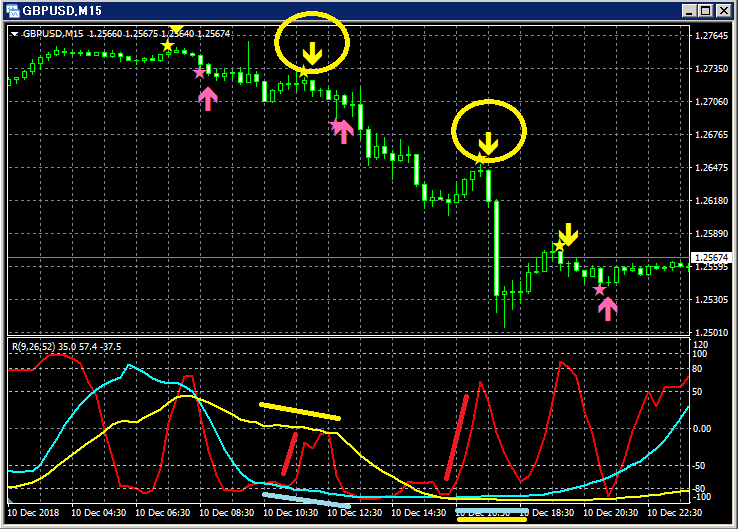
Top row: mBDSR
Among the three RCI lines, only RCI9 is clearly rising.
If RCI9 turns down, all three RCI lines may start falling.
In other words, prices may strongly decline.
In such a situation, mBDSR’s pullback/sell signal (yellow arrows circled in a circle) lights up.
In the first signal, a bearish candle appears immediately after lighting up, and afterward the price continues to fall smoothly.
It is evident thatthe pricehas been moving down.
In the second signal, immediately after lighting up, two bearish candles including a large bearish candle appear, and the pricedrops significantly.
Therefore, the pricehas been falling considerably.
BODSOR sales page ishere.

Twitter
https://twitter.com/RCIX3Line
Blog
http://bodsor.blog.fc2.com/
Investment Navigator+
https://fx-on.com/navi/serial/?id=359
YouTube
https://www.youtube.com/channel/UCL-g5uAlesiWVJEDtWlFvGw
Examples of push-like buy and pullback/sell signals on USD/JPY on the 1-hour chart
※In the charts in this article, for convenience,円 (yen), straight lines, and squares may be drawn or added, so please understand.
Please note.


