

【Win with mBDSR (RCI2 full filter)!】Looking for signs of rebound near the rising trend line
0
【Master RCI to Win Extremely!! Trend Reversal, Buy on Dips, Sell on Rallies】
Indicator【BODSOR・mBDSR】that delivers power when used with RCI
Methods and Case Studies (PDF) ★GogoJungle AWARD2020 Winner★
https://www.gogojungle.co.jp/tools/indicators/11836
The PDF contains 358 files (over 1,400 pages, over 470,000 characters).
March 25, 2025 Dollar-Yen 5-minute chart +55 pips

Early this year, the MT5 version Beta was released!!
mBDSR (Product ID 11836) Purchase bonus】MT5 version indicator (Beta)
“mBDSR (no filter, RCI filter, MA filter)”
https://www.gogojungle.co.jp/tools/indicators/56765
To help you use the MT5 version of mBDSR more effectively, we have added 62 more PDFs (over 210 pages, over 200 charts, over 80,000 characters).
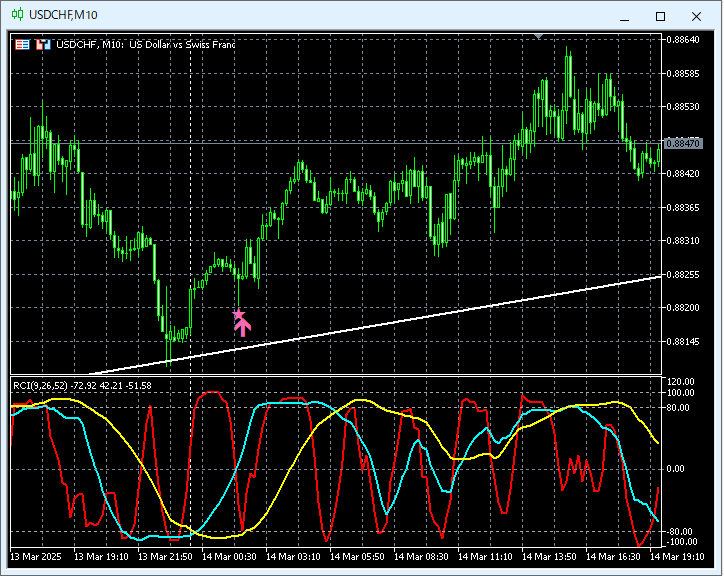
MT5includes10-minute chartas standard.
EURUSD (USDCHF) 10-minute chart
The higher-timeframe charts are omitted. Also,Overview of drilling down from higher timeframes to lower timeframes using RCIis explained in detail in the accompanying PDF, so it is omitted here as well.
In actual trading, when formulating a plan,understanding higher-timeframe conditionsanddrilling down from higher to lower timeframes using RCIare extremely important.
Looking at the 10-minute chart above,an upward trendlinerebounded near the line. Afterward,the mBDSR (RCI two-filter) buy-the-dip signalactivated and the price rose solidly.
From this example,a trade technique focused on reversals at an upward trendlineandthe compatibility with mBDSR signalsare evident.
※Please note that the charts shown in this article may have added circles, lines, or rectangles for explanation purposes.
Indicator【BODSOR・mBDSR】that delivers power when used with RCI
Methods and Case Studies (PDF) ★GogoJungle AWARD2020 Winner★
https://www.gogojungle.co.jp/tools/indicators/11836
The PDF contains 358 files (over 1,400 pages, over 470,000 characters).
Most of them are examples that decompose how to logically link higher and lower timeframes using three RCI lines, sequentially examining multiple lower timeframes, and ultimately awaiting a dip buying or pullback selling timing (i.e., mBDSR signals) on the lower timeframe.many focus on identifying points where multiple entry reasons overlap.
Also included is a method to explore ascent and descent targets using three RCI lines.
In the PDF explanations,over 1,350 chartsare used.

× ![]()


