

The Moving Average, Counter Trend Line, Double Top, and mBDSR (RCI two-filter) that are being emphasized (3)
0
【Master RCI to Win Extremely!! Trend Reversal, Buy Dips, Sell Rallies】
Indicator【BODSOR・mBDSR】that proves powerful in combination with RCI
Methods and Case Studies (PDF) ★GogoJungle AWARD2020 Winner★
https://www.gogojungle.co.jp/tools/indicators/11836
The PDF file includes 358 items (over 1,400 pages, over 470,000 characters in total).
March 25, 2025 USD/JPY 5-minute chart +55 pips

At the start of this year, the MT5 version Beta was released!!
Purchased bonus for mBDSR (Product ID 11836) MT5 version Indicator (Beta)
“mBDSR (no filter, RCI filter, MA filter)”
https://www.gogojungle.co.jp/tools/indicators/56765
To help you use the MT5 version of mBDSR more effectively, an additional 52 PDFs (over 180 pages, over 170 charts, over 70,000 characters in total) were added.
USD/CAD 6-minute chart
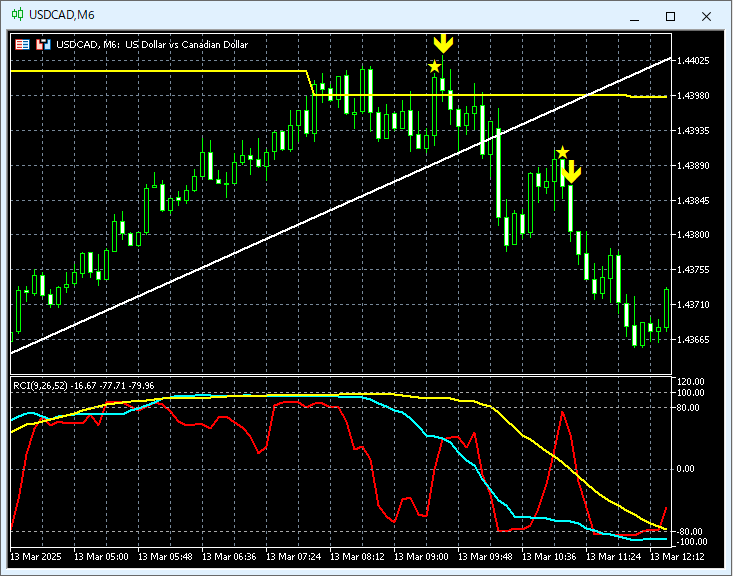
The higher time-frame status is omitted.
On the 6-minute chart above,near the 21-period EMA on the 4-hour chartthe return-sell signal ofmBDSR (2 RCI filters)is weakening/reversing.Has broken below the counter-trend line.
And in the subsequent rise,the return-sell signal ofmBDSR (2 RCI filters)
From this example,the trade method focusing on important moving averages and counter-trend linesandthe signals of mBDSRlighted up, and the price started to fall further right after.show a high level of compatibility.
※Please note that in the charts introduced in this article, for convenience of explanation, circles, lines, and rectangles may be added.
Indicator【BODSOR・mBDSR】that proves powerful in combination with RCI
Methods and Case Studies (PDF) ★GogoJungle AWARD2020 Winner★
https://www.gogojungle.co.jp/tools/indicators/11836
The PDF file includes 358 items (over 1,400 pages, over 470,000 characters in total).
Many of them are compiled in a format that links the upper and lower timeframes logically using the three-line RCI, sequentially examining the statuses of multiple lower timeframes, and ultimately waiting for a dip-buy or a pullback-sell timing (i.e., the mBDSR signal) on the lower timeframes.
In addition,there are many that emphasize capturing points where multiple entry reasons overlap..
Also included is a method for exploring upside and downside targets using three-line RCI.
In the PDF explanations,more than 1,350 chartsare used.

× ![]()


