

Previous high of the upper leg and the return sell signal of mBDSR (RCI 2-lines filter) (4)
This year, the MT5 Beta version was released!!
mBDSR (Product ID 11836) Purchase Bonus
https://www.gogojungle.co.jp/tools/indicators/56765
【Master RCI!! Trend Reversal, Buy on Dips, Sell on Rallies】
An indicator that shines when used in combination with RCI【BODSOR・mBDSR】
Methods & Case Studies (PDF) ★GogoJungle AWARD2020 Winner★
https://www.gogojungle.co.jp/tools/indicators/11836
Kiwi Dollar NZDUSD 2-hour chart
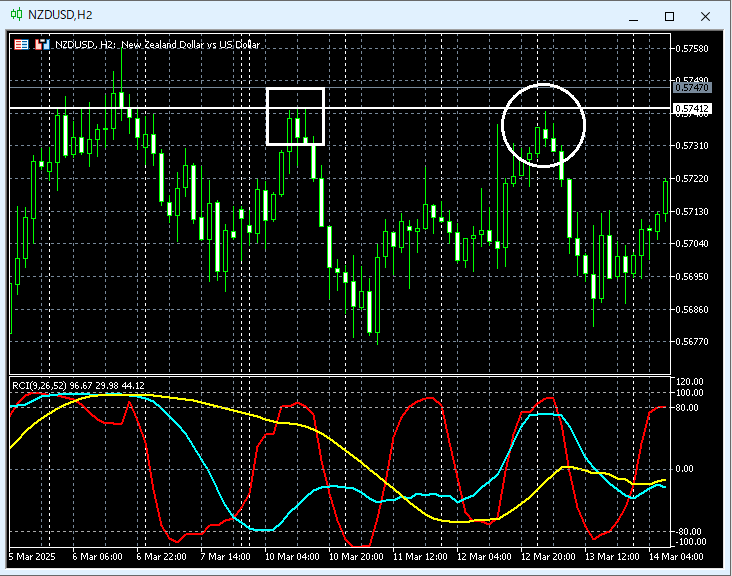
Looking at the area circled in white on the 2-hour chart aboveThe line indicating the previous high (horizontal line)has risen up to near that area. If this line is conscious as resistance, it might be a scene to aim for selling on rallies. We will carefully watch for signs of reversal on lower timeframes.
Kiwi Dollar NZDUSD 6-minute chart
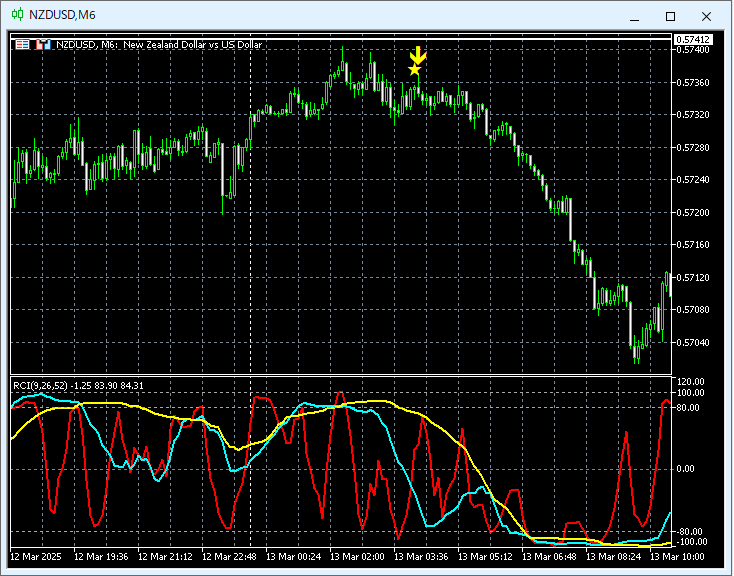
From the 6-minute chart above,the line indicating the previous high on the higher timeframenearby,mBDSR (2-filter of RCI) stance sell signallights up, and price declines sharply.
From this example,the trade method focusing on the previous high (horizontal line)andthe signal of mBDSRshow strong compatibility.
Also, in this example, placing the stop-loss a little above the recent highRecent Highcan create a trade with good risk-reward and high edge.
※Please note that for convenience of explanation, charts in this article may include circles, lines, or boxes.
Indicator that shines when combined with RCI【BODSOR・mBDSR】
Methods & Case Studies (PDF) ★GogoJungle AWARD2020 Winner★
https://www.gogojungle.co.jp/tools/indicators/11836
The PDF file contains 358 files (over 1,400 pages, over 470,000 characters).
Many of them are summaries of cases where, by linking higher and lower timeframes logically using three RCI lines, the situation of multiple lower timeframes is examined in order, ultimately waiting for dips or pullbacks timing on the lower timeframe (i.e., the mBDSR signal).
Also,many are focused on capturing points where multiple entry reasons overlap.There are also many that include this.
Additionally,the method to explore upside/downside targets using three RCI linesis included.
In the PDF explanations,more than 1,350 chartsare used.

× ![]()


