

【RCI3 Three-Line+mBDSR】Dollar Index 1-hour Chart Example of a Retracement Sell Signal
※Campaign is ongoing until January 10, 2019.
BODSOR (mBDSR) sales page ishere.
※ BODSOR and mBDSR are indicators developed to enhance entry precision when using three-line RCI for buying on dips or selling on rallies.
They are designed to improve the accuracy of entries.
The figure below is a 1-hour chart of the U.S. Dollar Index.
USD index 1-hour chart
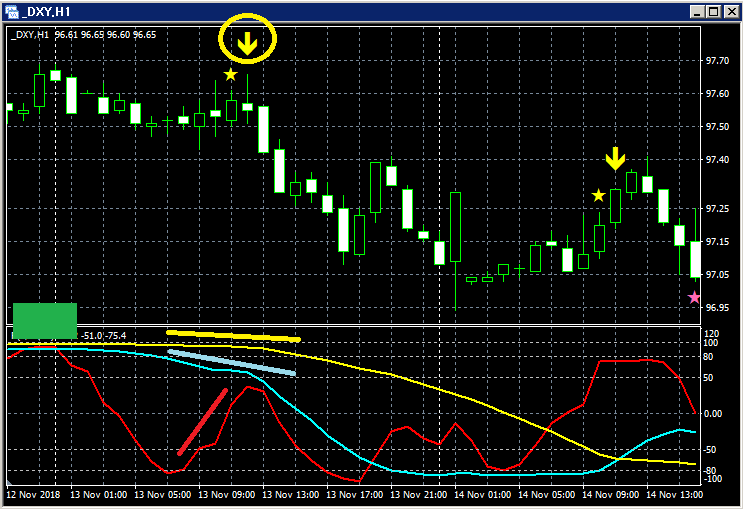
Top row:mBDSR
Among the three RCI lines, only RCI9 is clearly rising.
If RCI9 reverses and slopes downward, all three RCIs may be turning down.
In other words, price could undergo a strong decline.
In such a situation, the mBDSR return-sell signal (yellow arrow circled) is lighting up.
Directly after the signal lights up, three consecutive bearish candles appear, and price continues to fall. This can be observed as
shown.
This is a very common pattern where the signal lights up on a pullback after RCI forms a triple top and RCI9 dips.
)
Note that the reversal of the rising RCI9 is confirmed after two bearish candles appear.
BODSOR (mBDSR) sales page ishere.

Twitter
https://twitter.com/RCIX3Line
Blog
http://bodsor.blog.fc2.com/
Investment Navigator+
https://fx-on.com/navi/serial/?id=359
YouTube
https://www.youtube.com/channel/UCL-g5uAlesiWVJEDtWlFvGw
Examples of Buy on Dips and Sell on Rallies for USD/JPY on the 1-hour timeframe
※ In the charts within this article, for convenience of explanation, circles, lines, and rectangles may be drawn, so please note.
Please understand.


