

Create an EA to verify the effectiveness of "RCI3 Full Line + mBDSR"
※mBDSR is an indicator developed to improve the entry precision when buying on dips or selling on rallies using the RCI 3-line method.
This indicator was developed for that purpose.
In the case of an EA, backtesting and forward testing are methods to demonstrate its effectiveness as concrete numbers,
but how should the effectiveness of an indicator be demonstrated?
mBDSRitself iscombined with theRCI 3-line
and it was developed as an indicator, but here we take a certain timeframe for USD/JPY as an example and
,“RCI 3-line + mBDSR”to demonstrate its effectiveness with concrete numbers, the entry conditions are“RCI 3-line +
mBDSR”decided only by, and then setting TP and SL to create a risk-reward favorable EA for backtesting
was performed.
(The results below are only an example...)
EA Overview
Currency pair: USD/JPY
Timeframe: not disclosed
Entry conditions:Decided only from RCI and mBDSR(Details are unpublished)
Lot size: 0.1 lots (fixed)
TP: 105 pips (fixed)
SL: 15 pips (fixed)
Other (settlement related): no breakeven or trailing stop settings
Spread: 1 pip (fixed)
Trade direction: sell only
Number of positions: no limit
Backtest results (Period: 2007-01-01 to 2018-07-31)
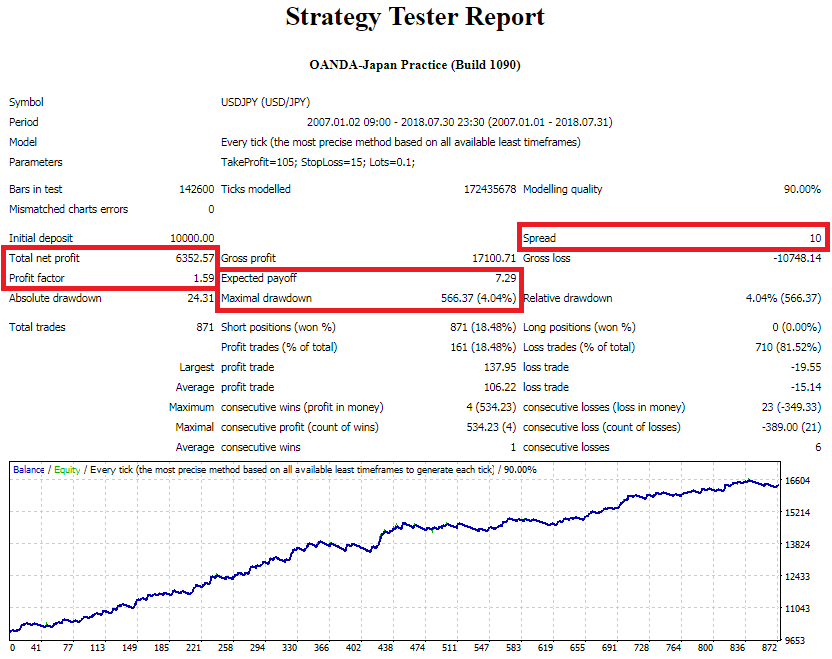
Period: 2007-01-01 to 2018-07-31
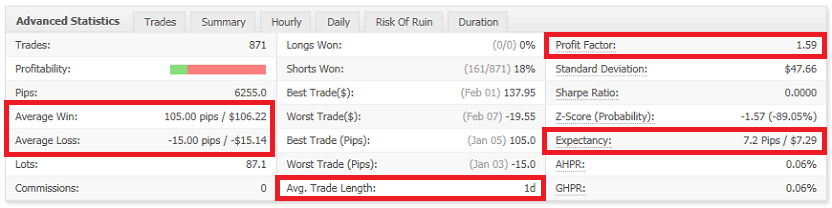
Total trades: 871
Profit factor: 1.59
Net profit: 6,352.57 USD
Maximum drawdown: 566.37 USD
Net profit / Max drawdown: 11.21
Expected gain: 7.29 USD (7.2 pips)
Average trade duration: 1 day
The entry conditions aredetermined only from RCIandmBDSR, yetthe profitability factor value
is 1.59and yields good results. Considering that no other indicators are used at all, the above example can be said to show that
the combination of “RCI and mBDSR”is very effective, and I think
it demonstrates that.
The TP (= 105 pips) is 7 times the SL (= 15 pips)risk-reward ratio is highand yields such favorable results as above
Therefore,the combination of RCI and mBDSR is “very effective at catching timings when the price moves strongly in one direction”
as can be inferred from this backtest.
Also, in the above example,the average trade duration is 1 dayand it is not a so-called “scalping.”
Additionally,the expected gain is 7.2 pipswhich means the test was conducted under conditions less affected by spreads.
BODSOR (mBDSR) sales page ishere.

Twitter
https://twitter.com/RCIX3Line
Blog
http://bodsor.blog.fc2.com/
Investment Navi+
https://fx-on.com/navi/serial/?id=359
YouTube
https://www.youtube.com/channel/UCL-g5uAlesiWVJEDtWlFvGw
Example of dip-buy and rally-sell signals on USD/JPY 1-hour chart


