

Consider the current dollar-yen situation from [RCI three lines + mBDSR]
※BODSOR is an indicator developed to enhance the entry accuracy when performing buy-on-dips or selling on rallies using three-line RCI.
This time, an extra indicator mBDSR has been included with 【BODSOR】.
The development concept of 【mBDSR】 (the extra indicator) is the same as 【BODSOR】
however,the arrow sign generation conditions and its calculation method are completely different.
Because more arrow signals occur than with 【BODSOR】, it increases the likelihood of capturing entry opportunities that could not be captured with 【BODSOR】.
First, here is the USD/JPY monthly chart.
USD/JPY Monthly
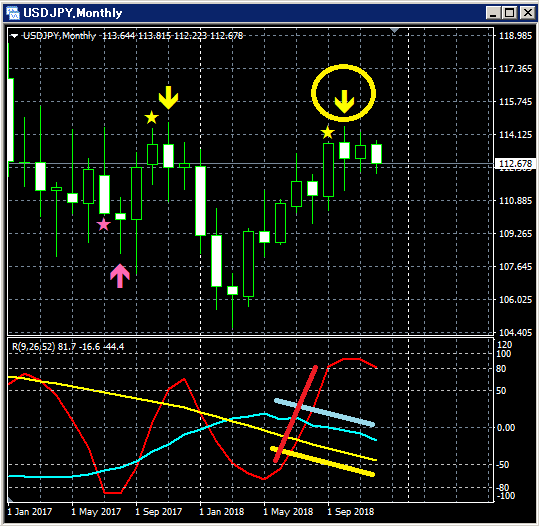
Upper row: mBDSR
Next is the USD/JPY daily chart.
USD/JPY Daily
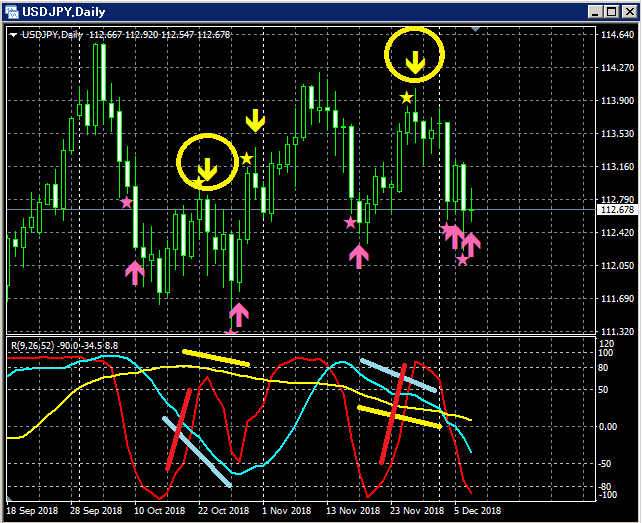
Upper row: mBDSR
Next is the USD/JPY 4-hour chart.
USD/JPY 4-hour
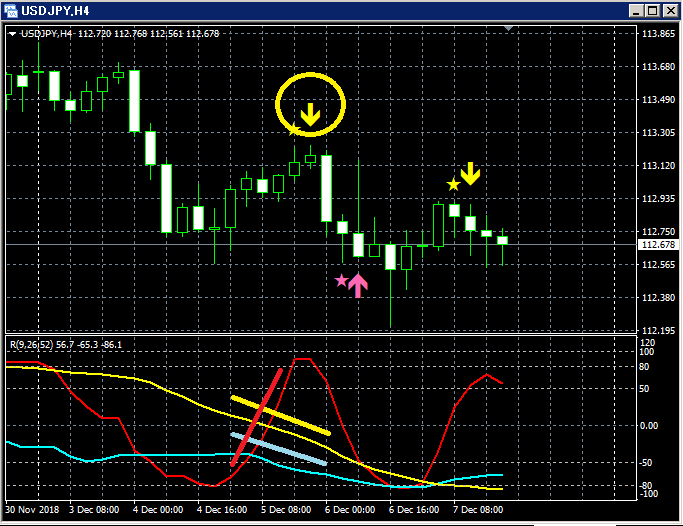
Upper row: mBDSR
Currently, although the daily chart is showing a very weak form, on the 4-hour chart the “RCI three-line +
The sales page for BODSOR (mBDSR) is here..
※ Campaign runs until January 10, 2019.

https://twitter.com/RCIX3Line
Blog
http://bodsor.blog.fc2.com/
Invest Navi+
https://fx-on.com/navi/serial/?id=359
YouTube
https://www.youtube.com/channel/UCL-g5uAlesiWVJEDtWlFvGw
Examples of pullback buying and pullback selling signals on the 1-hour chart of USD/JPY
※ In the charts in this article, for readability, you may see additions such as yen marks, straight lines, or rectangles drawn, so please understand.


