

"RCI3 Triple Line + mBDSR" 4-hour level example of a pullback selling signal (Kiwi yen)
※Campaign is ongoing until January 10, 2019.
BODSOR (mBDSR)sales page ishere.
※ BODSOR and mBDSR are indicators developed to improve entry accuracy when using the RC I 3-line for buying on dips or selling on rallies.
These indicators were developed to enhance entry precision.
The figure below is the Kiwi Yen (NZDJPY) 4-hour chart.
Kiwi Yen (NZDJPY) 4-hour chart
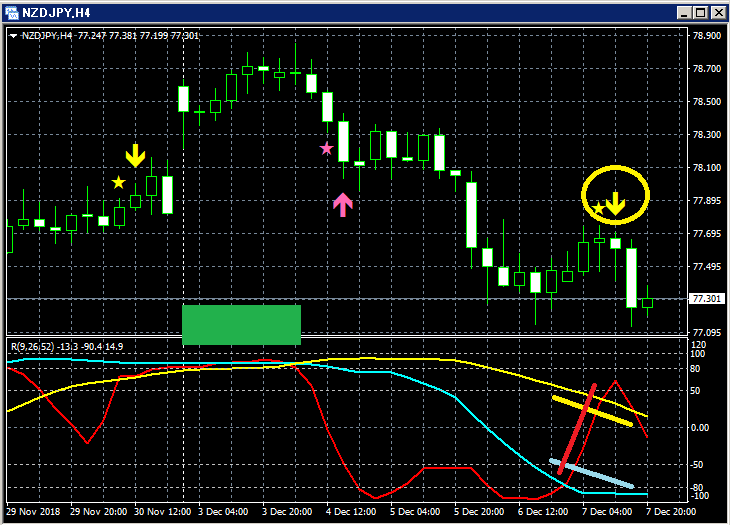
Top: mBDSR
Bottom: RCI 3-line (Red: RCI9, Light blue: RCI26, Yellow: RCI52)
Among the three RCI lines, only RCI9 is clearly rising.
If RCI9 turns down, all three RCIs may turn down, indicating a possible strong price decline.
In other words, price could also fall sharply.
Among the three RCI lines, only RCI9 is clearly rising.
If RCI9 turns down, all three RCIs may turn down, indicating a possible strong price decline.
In other words, price could also fall sharply.
In such a situation,mBDSR’s rebound sell signal (yellow arrow circled) lights up.
You can see two consecutive bearish candles occurring right after the signal lights up.
BODSOR sales page ishere.

Twitter
https://twitter.com/RCIX3Line
Blog
http://bodsor.blog.fc2.com/
Investing Navi+
https://fx-on.com/navi/serial/?id=359
YouTube
https://www.youtube.com/channel/UCL-g5uAlesiWVJEDtWlFvGw
Example of dip-buying and rally-selling signals on USD/JPY 1-hour chart
※In the charts within this article, for convenience of explanation, circles, straight lines, squares, and other marks may be added.
Please understand.
× ![]()


