

RCI3 double top and RCI3 double bottom and counter trend line and double bottom and the sign of mBDSR
【Mastering RCI!! Trend Reversal, Buy on Dips, Sell on Rallies】
Indicator that shines in combination with RCI【BODSOR・mBDSR】
and methodology・case studies (PDF) ★GogoJungle AWARD2020 winner★
https://www.gogojungle.co.jp/tools/indicators/11836
EURUSD 1-minute chart
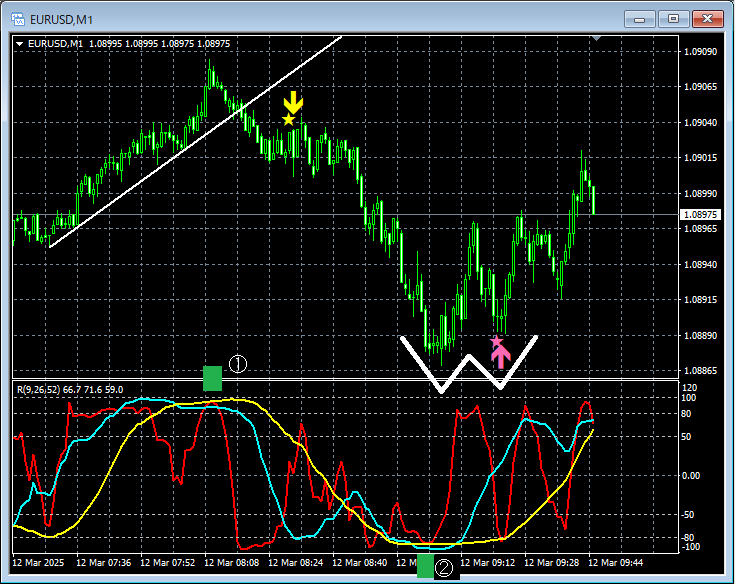
RCI triple toprise up to→Counter-trend linebreak→mBDSR (RCI two-filter) sell on rally signal→Triple bottomdown to→Double bottomon the right-side valleymBDSR (RCI two-filter) buy on dip signallights up and climbs.
From this example,a trading method focusing on RCI three-line, counter-trend lines, and double bottomsandthe signals of mBDSRshow a high degree of harmony.
*Please note that in the charts introduced in this article, for convenience of explanation, circles, straight lines, and squares may be added.
Indicator that shines in combination with RCI【BODSOR・mBDSR】
and method・case studies (PDF) ★GogoJungle AWARD2020 winner★
https://www.gogojungle.co.jp/tools/indicators/11836
The PDF file includes 358 items (over 1,400 pages, over 470,000 characters).
Most of them aresummaries of analysis of multiple lower-timeframe conditions by logically linking higher and lower timeframes using three RCI lines, ultimately waiting for buy on dips or sell on rallies signals on the lower timeframe (i.e., mBDSR signals)..
Additionally,many focus on points where multiple entry rationale coincide..
Furthermore,it also includes methods to explore upside and downside targets using three RCI lines..
In the explanations within the PDF file,more than 1,350 chartsare used.

× ![]()


