

Resistance zone and mBDSR (RCI2 two-filter) short selling signal
【Mastering RCI!! Trend Reversal, Buy the Dip, Sell on Retracements】
Indicator that shines when combined with RCI【BODSOR・mBDSR】
and techniques & case studies (PDF) ★GogoJungle AWARD2020 winner★
https://www.gogojungle.co.jp/tools/indicators/11836
EUR/USD 5-minute chart
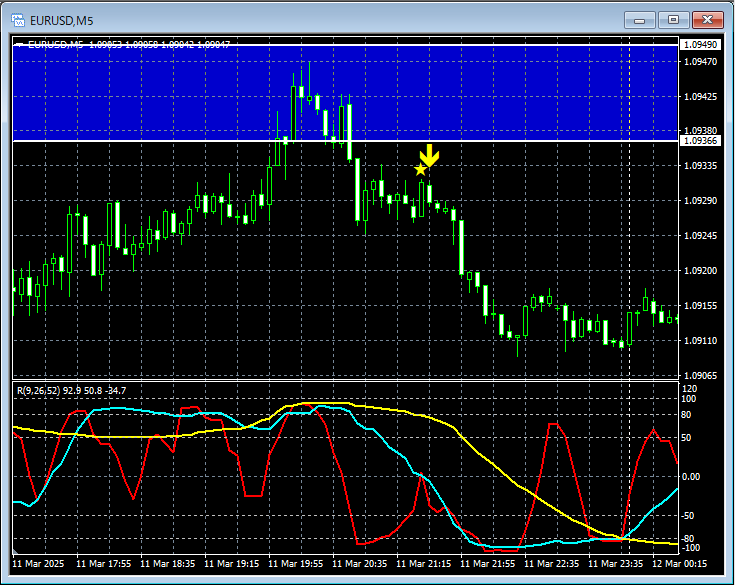
The higher-timeframe situation is omitted, but on the above 5-minute chart, in the higher timeframeresistance zonewas reached and then it paused downward. After that,mBDSR (2-RCI filters)sell-into-strength signal lights up, and price declines steadily.
From this example,a trading method focused on resistance zonesandthe harmony with mBDSR signalsis evident.
※Please note that, for convenience of explanation, charts in this article may include added circles, lines, or squares.
Indicator that shines when combined with RCI【BODSOR・mBDSR】
and techniques & case studies (PDF) ★GogoJungle AWARD2020 winner★
https://www.gogojungle.co.jp/tools/indicators/11836
The PDF file includes 358 items (over 1,400 pages, over 470,000 characters).
Many of them areexamples that logically link higher-timeframe and lower-timeframe using 3-line RCI, sequentially examining multiple lower-timeframes, and ultimately waiting for dip-buying or pullback-selling timing (i.e., mBDSR signals) on the lower timeframe.
Additionally,there are many focuses on identifying points where multiple entry reasons coincide.
Furthermore,there are methods that explore upside and downside targets using three-line RCIas well.
In the explanations within the PDF,over 1,350 chartsare used.

× ![]()


