

From the sign of "RCI3 Single Line + mBDSR," the trend reversal flow (NZDUSD 5-minute chart)
※Campaign is ongoing until January 10, 2019.
The BODSOR sales page ishere.
※ BODSOR is an indicator developed to improve entry accuracy when using the three-line RCI to execute pullback buying and pullback selling.
This time, a bonus indicator「mBDSR」has been attached to the【BODSOR】.
【mBDSR】(Bonus indicator):
The development concept is the same as【BODSOR】, but the arrow signal generation conditions and their calculation method are completely
different.
Because more arrow signals occur than in【BODSOR】, there is a higher possibility of capturing entry opportunities that could not be captured with【BODSOR】.
The figure below is the NZDUSD 5-minute chart.
NZDUSD 5-minute chart
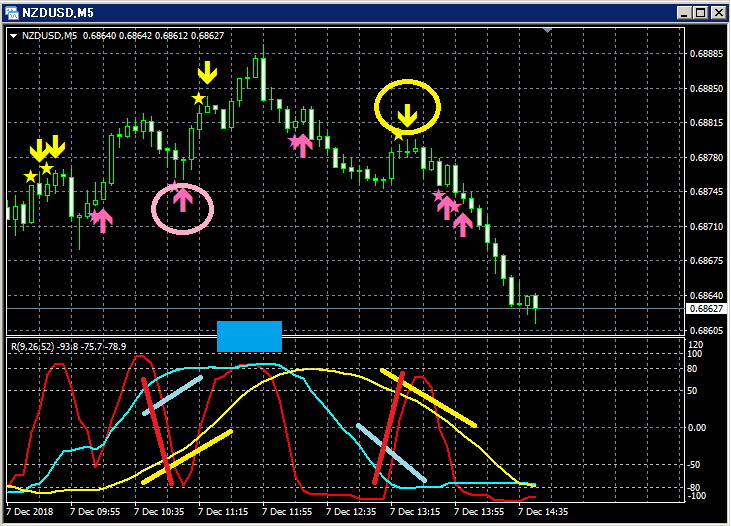
Upper row:mBDSR
(1) Pullback buying
Among the three RCI lines, only RCI9 is clearly turning downward.
If RCI9 reverses and rises, there is a possibility that all three RCI lines rise.
In other words, price may rise strongly.
In such a situation,mBDSR pullback buy signal (pink arrows circled in a circle) lights up.
(2) So-called RCI double top (RCI9 and 26 both higher)
(3) RCI52 turns down
(4) Return sell signal
Among the three RCI lines, only RCI9 is clearly rising.
If RCI9 reverses and falls, there is a possibility that all three RCI lines fall.
In other words, price may fall strongly.
In such a situation,mBDSR return sell signal (yellow arrows circled in a circle) lights up.
Thereafter, price clearly falls.
The BODSOR sales page ishere.
https://twitter.com/RCIX3Line
Blog
http://bodsor.blog.fc2.com/
Investment Navi Plus
https://fx-on.com/navi/serial/?id=359
YouTube
https://www.youtube.com/channel/UCL-g5uAlesiWVJEDtWlFvGw
Examples of pullback buying and pullback selling signals in USD/JPY on the 1-hour chart


