

【RCI3 single line + mBDSR】NZDUSD Daily Timeframe Pullback Buy Signal Example
Note: Campaign is ongoing until January 10, 2019.
BODSOR (mBDSR)sales page ishere.
BODSOR and mBDSR are indicators developed to improve entry accuracy when buying on dips or selling on rallies using three-line RCIs.
The figure below is a daily chart of NZD/USD.
NZD/USD Daily
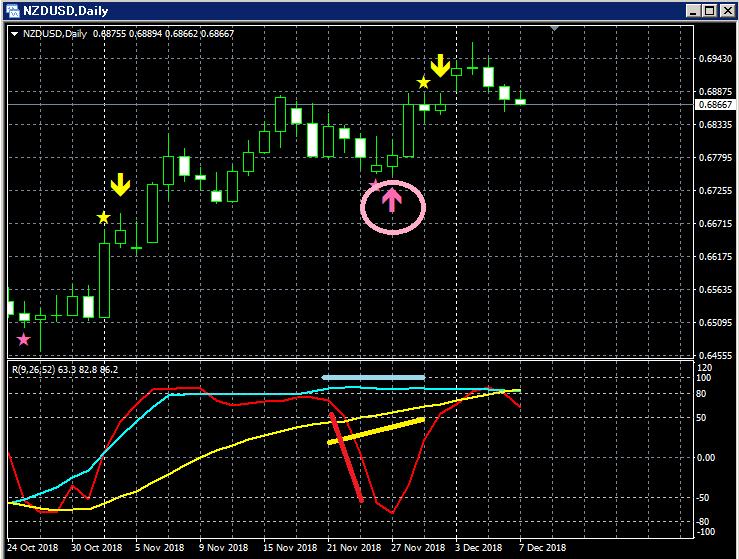
Upper row:mBDSR
Lower row: RCI three lines (red: RCI9, light blue: RCI26, yellow: RCI52)
Among the three RCI lines, only RCI9 is clearly declining.
If RCI9 reverses and rises, there may be a situation where all three RCIs rise.
In other words, price may also rise strongly.
In such a scenario,mBDSR’s dip-buy signal (pink arrow circled) lights up.
Immediately after the signal lights, two bullish candles appear in succession, and thereafter the price continues to rise steadily.
This can be observed.
Moreover, the reversal of the declining RCI9 is only confirmed after two bullish candles have formed and the high is broken.
.
BODSOR (mBDSR) sales page ishere.

Twitter
https://twitter.com/RCIX3Line
Blog
http://bodsor.blog.fc2.com/
Investor Navi Plus
https://fx-on.com/navi/serial/?id=359
YouTube
https://www.youtube.com/channel/UCL-g5uAlesiWVJEDtWlFvGw
Examples of dip-buying and pullback-selling signals on the 1-hour chart for USD/JPY
Note: In this article's charts, for convenience of explanation, drawings such as yen symbols, straight lines, and squares may be added.
Please understand.


