

"RCI 3-line + mBDSR" Daily chart level example of pullback sell signal (AUDNZD)
0
※Campaign is ongoing until January 10, 2019.
BODSOR (mBDSR)sales page ishere.
※ BODSOR and mBDSR are indicators developed to improve the entry precision when buying on dips or selling on rallies using the RCI 3-line setup.
The figure below is a daily chart of AUD/NZD.
AUD/NZD Daily
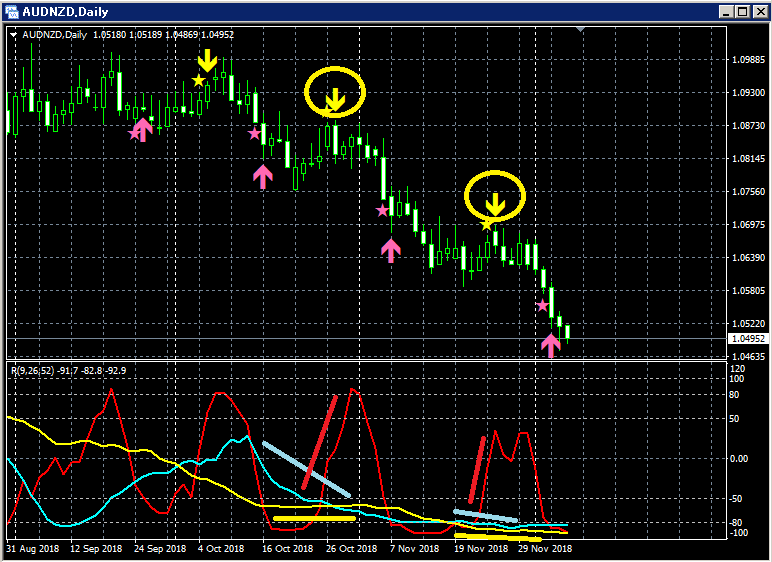
Upper row:mBDSR
Among the three RCI lines, only RCI9 is clearly rising.
If RCI9 reverses and falls, all three RCI lines may turn down.
In other words, price may also fall strongly.
In such a scenario,mBDSR’s return-sell signal (yellow arrows circled in circles) has lit up twice.
In either case, after the signal lights up, the price has been declining smoothly.
BODSOR (mBDSR) sales page ishere.

Twitter
https://twitter.com/RCIX3Line
Blog
http://bodsor.blog.fc2.com/
Investment Navi+
https://fx-on.com/navi/serial/?id=359
YouTube
https://www.youtube.com/channel/UCL-g5uAlesiWVJEDtWlFvGw
USD/JPY 1-hour chart example of dip-buy and rally-sell signals
※ The charts in this article may include added circles, lines, or rectangles for clarity.
Please understand.
× ![]()


