

【RCI3 One Line + mBDSR】 Nikkei 225 futures 30-minute chart pullback buy signal example
※ Campaign is ongoing until January 10, 2019.
The sales page for BODSOR (mBDSR) is here.
BODSOR is an indicator developed to improve entry accuracy when applying pullback buying and pullback selling using the RCI3 lines.
This time, the optional indicator 【mBDSR】 is included with 【BODSOR】.
【mBDSR】(optional indicator):
The development concept is the same as for 【BODSOR】, but the arrow signal generation conditions and its calculation method are completely
different.
Because more arrow signals occur than with 【BODSOR】, there is a higher likelihood of capturing entry opportunities that could not be grasped with 【BODSOR】.
The chart below is a 30-minute chart of the Nikkei 225 futures.
Nikkei 225 30-minute chart (December 6–7, 2018)
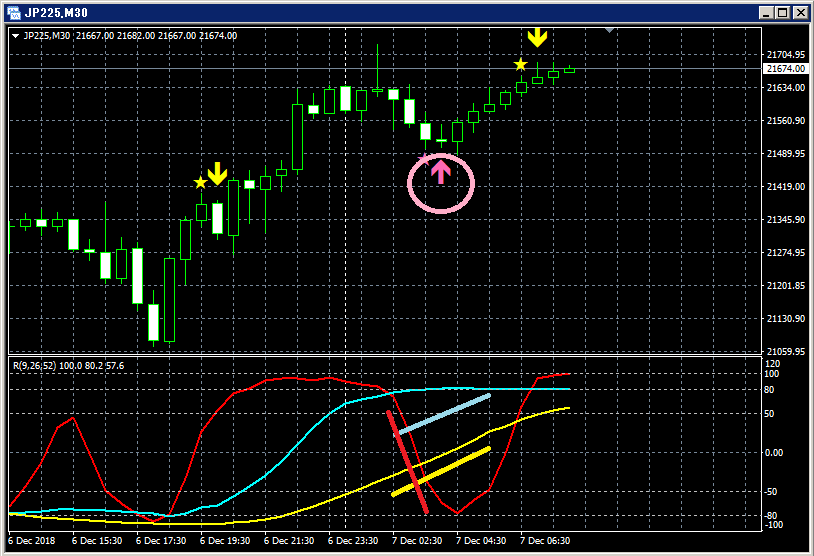
Top: mBDSR
Bottom: RCI three-line (Red: RCI9, Light blue: RCI26, Yellow: RCI52)
Among the three RCI lines, only RCI9 is clearly declining.
If RCI9 reverses and rises, there is a possibility that all three RCI lines will rise.
In other words, prices may rise strongly.
In such a scenario, the mBDSR buy-on-dip signal (pink arrow encircled in a circle) lights up.
After the signal lights up, the price rises smoothly, as can be seen.
(As a result, the candlestick three bars before the candle where the reversal of the declining RCI9 is confirmed already has the buy-on-dip signal confirmed.)
When the reversal of the declining RCI9 is confirmed, the buy-on-dip signal is already confirmed.
The sales page for BODSOR (mBDSR) is here.

Twitter
https://twitter.com/RCIX3Line
Blog
http://bodsor.blog.fc2.com/
Investment Navi+
https://fx-on.com/navi/serial/?id=359
YouTube
https://www.youtube.com/channel/UCL-g5uAlesiWVJEDtWlFvGw
Examples of pullback buying and pullback selling signals on USD/JPY 1-hour chart
※In the charts in this article, for convenience in explanation, yen symbols, straight lines, squares, etc. may be drawn, so please understand.


