

【RCI3 One Line + mBDSR】NZDJPY 30-minute chart Example of a pullback buy signal
Campaign is ongoing until January 10, 2019.
The sales page for BODSOR (mBDSR) is here.
BODSOR is an indicator developed to improve entry accuracy when buying on dips or selling on rallies using the RCI3-line.
to be more precise.
This time, an附附mBDSR extra indicator is included with 【BODSOR】.
【mBDSR】(the extra indicator):
The development concept is the same as that of 【BODSOR】, but the conditions for generating arrow signals and their calculation method are completely different.
It generates more arrow signals than 【BODSOR】, so the entry opportunities that could not be captured with 【BODSOR】 may be captured more often.
The figure below is a 30-minute chart of NZDJPY.
NZDJPY 30-minute chart (December 6–7, 2018)
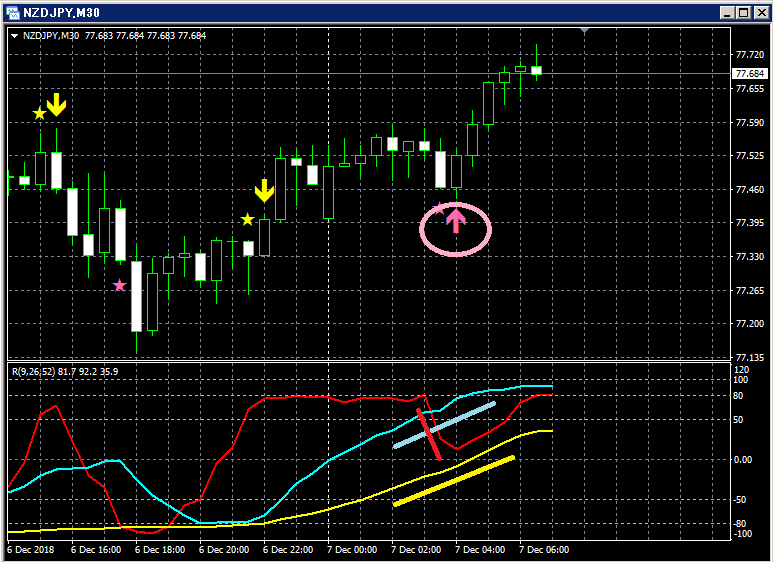
Upper row:mBDSR
Lower row: RCI three lines (red: RCI9, light blue: RCI26, yellow: RCI52)
Of the three RCI lines, only RCI9 is clearly descending.
If RCI9 reverses and rises, there is a possibility that all three RCI lines rise.
In other words, price may rise strongly.
In such a scenario, the mBDSR buy-the-dip signal (pink arrows circled) lights up.
Immediately after the signal lights, five bullish candles appear in succession, indicating price is rising smoothly.
You can see this clearly.
Note that the confirmation of the reversal ascent of the descending RCI9 occurs after two bullish candles have formed and the highs are updated.
BODSOR (mBDSR) sales page is here.

Twitter
https://twitter.com/RCIX3Line
Blog
http://bodsor.blog.fc2.com/
Invest Navi+
https://fx-on.com/navi/serial/?id=359
YouTube
https://www.youtube.com/channel/UCL-g5uAlesiWVJEDtWlFvGw
USD/JPY 1-hour time frame example of dip-buying and pullback-selling signals
※In the charts within this article, for convenience of explanation, you may see added lines, circles, and rectangles such as yen marks; please understand.


