

“Trend reversal flow from the sign of ‘RCI3 Ben Rain Line + mBDSR’ (NZDUSD 1-hour chart)”
Campaign is ongoing until January 10, 2019.
BODSOR (mBDSR)sales pagehere.
※ BODSOR and mBDSR are indicators developed to improve entry accuracy when performing buy-on-rebounds or sell-on-pullbacks using three RCI lines.
They are designed to enhance entry precision.
The figure below shows the NZDUSD 1-hour chart.
NZDUSD 1-hour chart
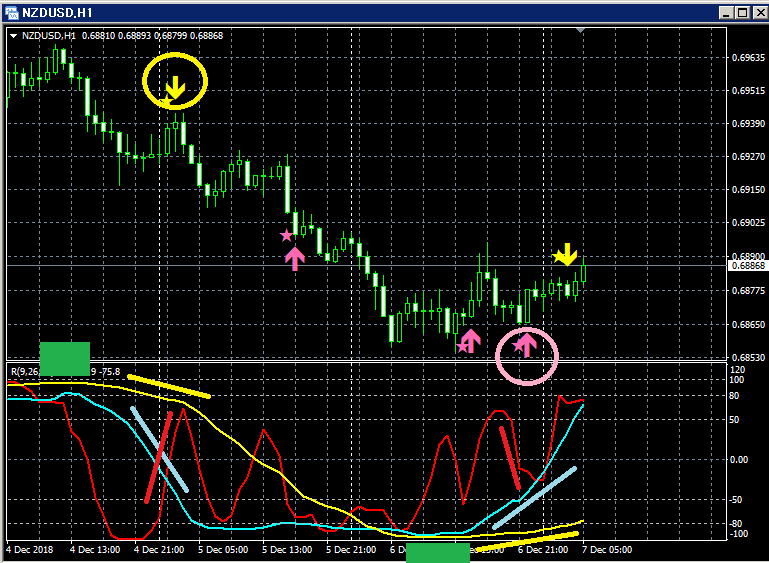
Upper row:mBDSR
(1) After RCI52 rises to above +90, price turns down.
(2) Sell-on-rebound signal
Among the three RCI lines, only RCI9 is clearly rising.
If RCI9 reverses and declines, all three RCIs may head down together.
In other words, price may also experience a strong drop.
In such a scenario,mBDSR’s sell-on-rebound signal (yellow arrow circled) lights up.
After that, price declines smoothly, as can be seen.
(3)After RCI52 falls to -90 or below and then reverses upward
(4) Buy-on-dips
Among the three RCI lines, only RCI9 is clearly declining.
If RCI9 reverses upward, all three RCIs may rise together.
In other words, price may rise strongly.
In such a scenario,mBDSR’s buy-on-dips signal (pink arrow circled) lights up.
BODSOR (mBDSR) sales page ishere.

https://twitter.com/RCIX3Line
Blog
http://bodsor.blog.fc2.com/
Investment Navi Plus
https://fx-on.com/navi/serial/?id=359
YouTube
https://www.youtube.com/channel/UCL-g5uAlesiWVJEDtWlFvGw
Example of buy-on-dips and sell-on-rebounds on USD/JPY 1-hour chart
※In the charts within this article, for ease of explanation, circles, straight lines, and squares may have been added.
Please note.


