

[MT5 Version] Important moving averages, swing lows, and mBDSR (RCI two-filter) bearish signal for the retracement AUDUSD
At the beginning of this year, the MT5 Beta version was released!!
mBDSR (Product ID 11836) Purchase Bonus: MT5 Indicator (Beta) “mBDSR (no filter, RCI filter, MA filter)”
https://www.gogojungle.co.jp/tools/indicators/56765
[Master RCI!! Trend reversal, buying on dips, selling on rallies]
An indicator that shows its power in combination with RCI: [BODSOR・mBDSR]
Methods & Case Studies (PDF) ★GogoJungle AWARD2020 Winner★
https://www.gogojungle.co.jp/tools/indicators/11836
MT5includes6-minute chartas the standard.
AUDUSD 6-minute chart
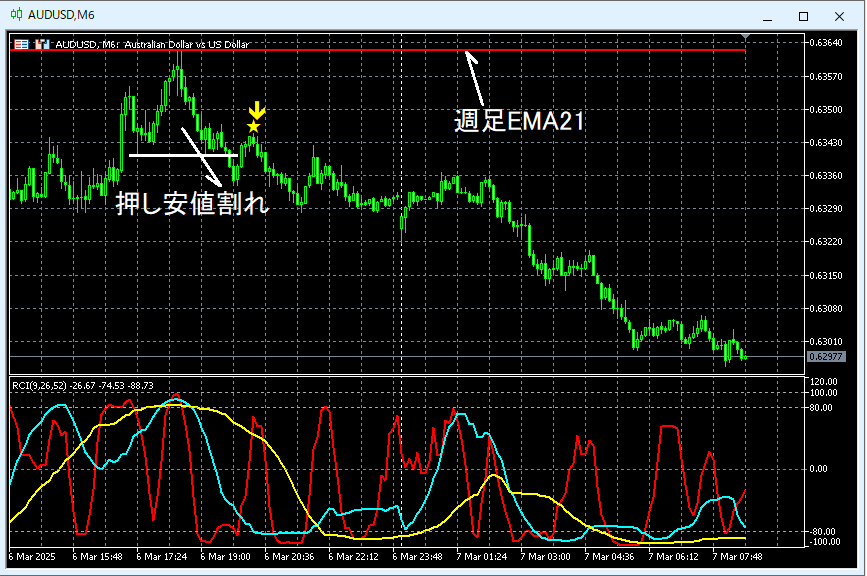
The higher-timeframe status is omitted. Looking at the 6-minute chart above, what is considered important in this case isthe weekly EMA21around which it seems to rebound. Andthe rebound signal after breaking the swing lowhas lit up, and the price has fallen further.
From this example,there is a strong synergy between moving averages/ Dow theory trading methodsandthe signals of mBDSR.
※ Please note that in this article, for convenience of explanation, circles, lines, and squares may have been added to some charts.
An indicator that shines in combination with RCI: [BODSOR・mBDSR]
Methods & Case Studies (PDF) ★GogoJungle AWARD2020 Winner★
https://www.gogojungle.co.jp/tools/indicators/11836
The PDF file includes 358 items (over 1,400 pages, over 470,000 characters).
Many of them explain a method that links the higher and lower timeframes logically using three RCI lines, sequentially examining the status of multiple lower timeframes, and ultimately waiting for the dip-buying or rally-selling timing (i.e., the mBDSR signal) on the lower timeframes.
Additionally,many focus on identifying points where multiple entry reasons overlap..
Also included is a method to explore upside/downside targets using three RCI lines.
In the PDF explanations,over 1,350 chartsare used.

× ![]()


