

Previous high of the upper leg and the pullback sell signal of mBDSR (RCI two-filter) (3)
At the beginning of this year, the MT5 beta version was released!!
mBDSR (Product ID 11836) Purchase Bonus: MT5 indicator (beta) “mBDSR (no filter, RCI filter, MA filter)”
https://www.gogojungle.co.jp/tools/indicators/56765
[Master RCI!! Trend reversal, Buy on dips, Sell on rebounds]
An indicator that shines when combined with RCI: 【BODSOR・mBDSR】
and methods, case studies (PDF) ★GogoJungle AWARD 2020 winner★
https://www.gogojungle.co.jp/tools/indicators/11836
Euro yen EURJPY Daily
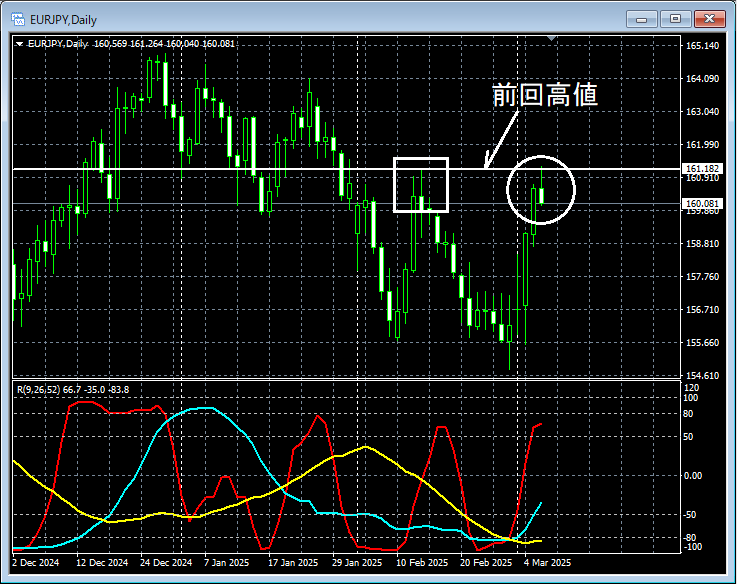
If you look at the area circled in white on the upper daily chart,the line indicating the previous high (horizontal line)has risen to near that area. If this line starts to be recognized as resistance, it might be a scene where selling on rebounds could be plausible. We will carefully watch for signs of reversal on lower timeframes.
EURJPY 15-minute chart
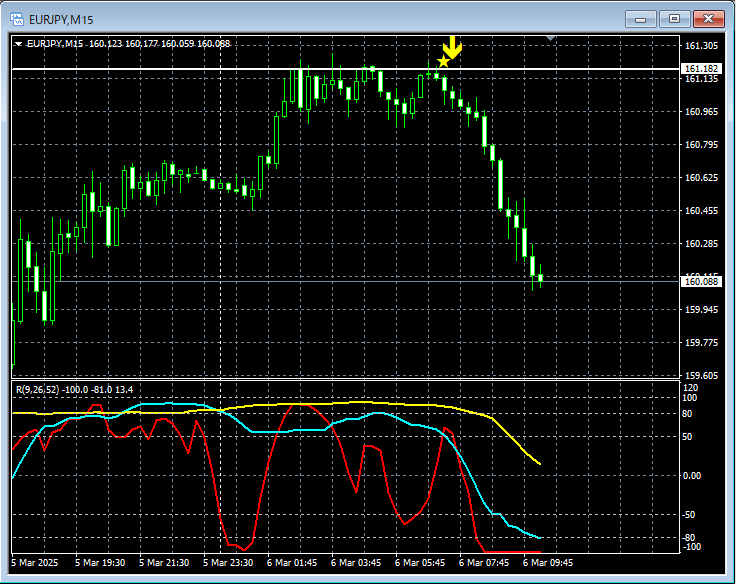
Looking at the above 5-minute chart,around the line indicating the previous high on the 1-hour chartnearby,mBDSR (two RCI filters) sell signalis lit up, and price is moving sharply lower.
From this example,a trading method focusing on the previous high (horizontal line)andthe signal of mBDSRshow a strong synergy.
Also, in this example, placing the stop-loss just above the recent highrecent highcan lead to a high risk-reward favorable trade.
※Note: In the charts presented in this article, circles, lines, and rectangles may be drawn for explanatory convenience, please understand.
An indicator that shines when combined with RCI: 【BODSOR・mBDSR】
and methods, case studies (PDF) ★GogoJungle AWARD 2020 winner★
https://www.gogojungle.co.jp/tools/indicators/11836
The PDF file includes 358 documents (over 1,400 pages, over 470,000 characters in total).
Most of them aredocuments compiled to logically link higher and lower timeframes using three RCI lines, examining multiple lower timeframes in sequence, and ultimately waiting for a dip buy or pullback sell timing (i.e., the mBDSR signal) on the lower timeframe.
Also,many of them focus on capturing points where multiple entry basis overlap..
Additionally,there are methods exploring upside and downside targets using the three-RCI-line approach.
In the description within the PDF files,more than 1,350 chartsare used.

× ![]()


