

Trend reversal flow viewed from the sign of "RCI3 Three-line + mBDSR" (Crude Oil XTIUSD 15-minute chart)
Note: Campaign ongoing until January 10, 2019.
BODSOR (mBDSR)sales page ishere.
BODSOR and mBDSR are indicators developed to improve the entry accuracy when buying on dips or selling on rallies using three RCIs.
They are designed to enhance entry precision in pullbacks and pullbacks using the three RCI lines.
The figure below is the 15-minute chart of crude oil XTIUSD.
Crude oil XTIUSD 15-minute chart
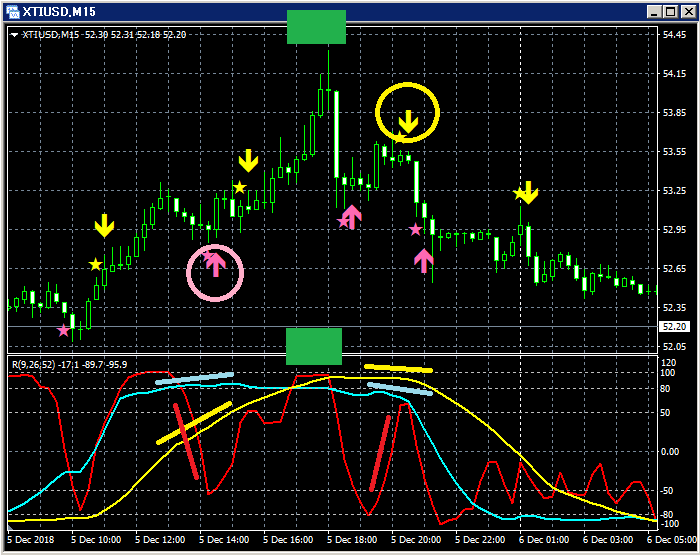
Upper row:mBDSR
(1) Buying the dips
Among the three RCI lines, only RCI9 is clearly declining.
If RCI9 reverses upward, all three RCIs may rise together.
In other words, there is a possibility of strong price upside.
In such a situation,mBDSR pullback buy signal (pink arrow circled) lights up.
Immediately after the signal lights up, a solid bullish candle forms, and thereafter the price rises steadily,
as can be seen.
(2) Rise to near the so-called "RCI 3-peak top"
(3) Sell the rally signal
Among the three RCI lines, only RCI9 is clearly rising.
If RCI9 reverses downward, all three RCIs may decline together.
In other words, there is a possibility of strong price decline.
In such a situation,mBDSR sell-the-rally signal (yellow arrow circled) lights up.
This is a highly favorable pattern for aiming a pullback after RCI9 temporarily declines from a form close to the so-called "RCI 3-peak top."
BODSOR (mBDSR) sales page ishere.

Twitter
https://twitter.com/RCIX3Line
Blog
http://bodsor.blog.fc2.com/
Investment Navi+
https://fx-on.com/navi/serial/?id=359
YouTube
https://www.youtube.com/channel/UCL-g5uAlesiWVJEDtWlFvGw
Examples of pullback buys and sell rallies on USD/JPY 1-hour chart
Note: In the charts within this article, for convenience of explanation, there may be added circles, straight lines, and squares. Please understand.
Please understand that such marks may be added for explanatory purposes.


