

[MT5 Version] Sell signal on rebound for prominent low, key moving averages, double top, and mBDSR (RCI with 2 lines filter)
【MT5 Version Beta】 has been released!!
mBDSR (Product ID 11836) Purchase Bonus】MT5 version Indicator (Beta) “mBDSR (No filter, RCI filter, MA filter)”
https://www.gogojungle.co.jp/tools/indicators/56765
【Master RCI!! Trend reversal, Buy on dips, Sell on rallies】
Indicator【BODSOR・mBDSR】that shines when used with RCI
and method/case studies (PDF) ★GogoJungle AWARD2020 winner★
https://www.gogojungle.co.jp/tools/indicators/11836
MT5provides3-hour timeframeas standard.
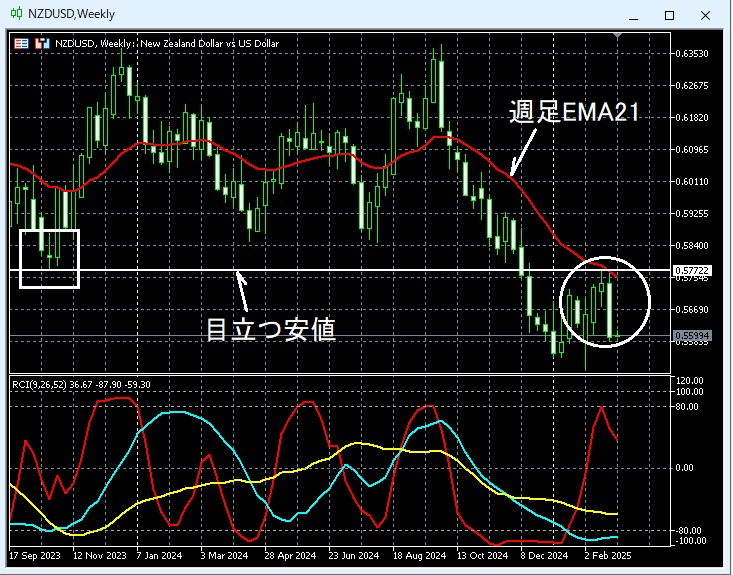
Kiwi dollar NZDUSD Weekly
Kiwi dollar NZDUSD 3-hour
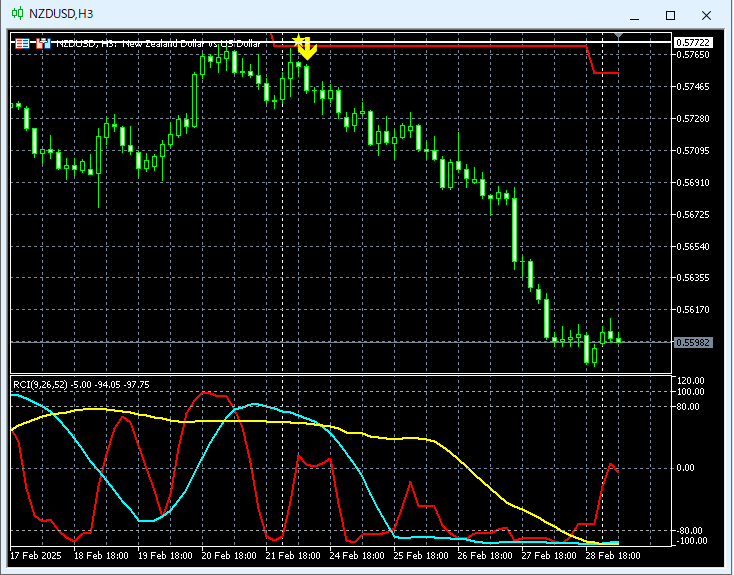
Looking at the 3-hour above,a line indicating a conspicuous high on higher timeframesand4-hour EMA200overlap arounda double topand it has been declining.mBDSR (RCI two-filter) Sell signalisthe timing of the decline starting on the right peak of the double topcaptured well.
From this example,a trade method focusing on conspicuous lows, moving averages, and double topsandthe signals of mBDSRshow high compatibility.
※Please note that in this article, for ease of explanation, circles, straight lines, and rectangles may be added to charts.
Indicator【BODSOR・mBDSR】that shines when used with RCI
and method/case studies (PDF) ★GogoJungle AWARD2020 winner★
https://www.gogojungle.co.jp/tools/indicators/11836
The PDF file includes 358 items (over 1,400 pages, over 470,000 characters).
Most of them areexamples that logically link higher/timeframes with lower timeframes using the three RCI lines, examining multiple lower-timeframe conditions progressively, and ultimately waiting for a dip-buy or pullback signal (i.e., mBDSR signal) on the lower timeframes..
Additionally,many focus on identifying points where multiple entry reasons overlap..
Note thatthe method for exploring rise and fall targets using three RCI linesis also included.
In the PDF descriptions,over 1,350 chartsare used.

× ![]()


