

【RCI3 Three-Line + mBDSR】NZDUSD 5-minute chart Example of a pullback sell signal
※Campaign is running until January 10, 2019.
The sales page for BODSOR is here.
※ BODSOR is an indicator developed to improve the entry accuracy when buying on pullbacks or selling on rallies using three RCI lines.
Now, 【BODSOR】 comes with a bonus indicator 【mBDSR】.
【mBDSR】 (Bonus Indicator):
The development concept is the same as 【BODSOR】, but the conditions for generating arrow signs and its calculation method are completely
different.
Since more arrow signs are generated than in 【BODSOR】, it increases the likelihood of catching entry opportunities that 【BODSOR】 could not capture.
The figure below is a 5-minute chart of NZDUSD.
NZDUSD 5-minute chart
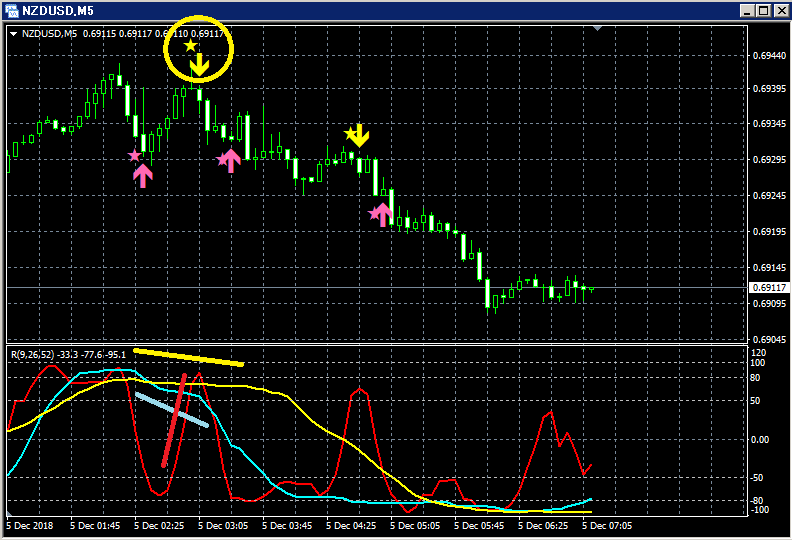
Top row:mBDSR
Among the three RCI lines, only RCI9 is clearly rising.
If RCI9 turns downward, all three RCI lines may turn downward.
In other words, price may also drop strongly.
In such a scenario,mBDSR pullback/sell alert (yellow arrows circled) lights up.
Immediately after the signal lights up, two consecutive bearish candles appear, and thereafter the price continues to decline smoothly
The BODSOR sales page is here.
Twitter
https://twitter.com/RCIX3Line
Blog
http://bodsor.blog.fc2.com/
Investment Navi+
https://fx-on.com/navi/serial/?id=359
YouTube
https://www.youtube.com/channel/UCL-g5uAlesiWVJEDtWlFvGw
Example of pullback buying and retracement selling signals on the USD/JPY 1-hour chart
※In the charts within this article, for convenience of explanation, you may see円 (yen) lines, straight lines, and rectangles drawn, so please note.


