

[MT5 Version] Break of Support and mBDSR (RCI2 Bands Filter) Sell Signal on the Return – GBP/USD Last Night (February 27, 2025)
0
========================
【Special Video vol.01/Blacksun】
https://www.gogojungle.co.jp/info/22955
【Special Video vol.02/Blacksun】
https://www.gogojungle.co.jp/info/22956
【Special Video vol.03/Blacksun】
https://www.gogojungle.co.jp/info/22957
========================
As a purchase bonus, the MT5 Beta version has been released!!
mBDSR (Product ID 11836) purchase bonus】 MT5 Indicator (Beta) “mBDSR (no filter, RCI filter, MA filter)”
https://www.gogojungle.co.jp/tools/indicators/56765
【Master RCI!! Trend reversal, dip-buying, and sell-on-rise】
An indicator that shines when used in combination with RCI — BODSOR and mBDSR
and methodology and case studies (PDF) ★GogoJungle AWARD2020 winner★
https://www.gogojungle.co.jp/tools/indicators/11836
MT5 features20-minute chart is provided as standard.
GBP/USD 20-minute chart
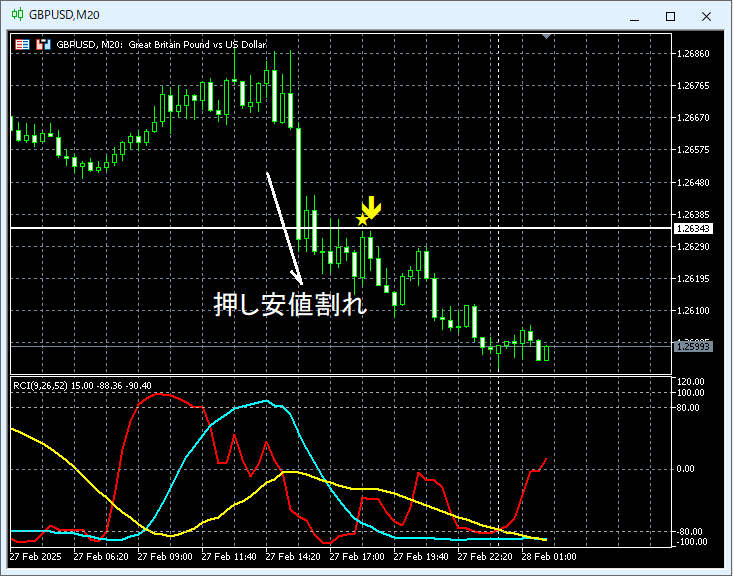
Above on the 20-minute chart,a break of the swing low occurs,near the swing low it rises up to,the mBDSR (RCI two-filter) overbought signal lights up and the price continues to fall.
If you drop from the higher timeframe to the lower timeframe (in this case, the 20-minute chart) using the three RCI lines and wait for the overbought signal, you can enter with even stronger justification; the explanation of this method is left to the attached PDF. It is not a random look at the 20-minute chart.
From this example,a trading method focused on Dow Theory andthe signals of mBDSR show a high degree of compatibility.
※ Please note that the charts introduced in this article may have added circles, straight lines, or boxes for convenience of explanation.
Indicator that shines when combined with RCI【BODSOR・mBDSR】
and methodology and case studies (PDF) ★GogoJungle AWARD2020 winner★
https://www.gogojungle.co.jp/tools/indicators/11836
The PDF file contains 358 items (over 1,400 pages, over 470,000 characters in total).
Most of them arecarefully laid out examples that use three-line RCI to logically link higher and lower timeframes, examine the status of multiple lower timeframes sequentially, and ultimately wait for dip-buying or a sell-on-rise timing (i.e., mBDSR signals) on the lower timeframe.
Additionally,many entries focus on identifying points where multiple entry reasons overlap.
Furthermore,the method also includes exploring upside and downside targets using three-line RCI..
In the explanations within the PDF file,more than 1,350 chartsare used.

【Special Video vol.01/Blacksun】
https://www.gogojungle.co.jp/info/22955
【Special Video vol.02/Blacksun】
https://www.gogojungle.co.jp/info/22956
【Special Video vol.03/Blacksun】
https://www.gogojungle.co.jp/info/22957
========================
As a purchase bonus, the MT5 Beta version has been released!!
mBDSR (Product ID 11836) purchase bonus】 MT5 Indicator (Beta) “mBDSR (no filter, RCI filter, MA filter)”
https://www.gogojungle.co.jp/tools/indicators/56765
【Master RCI!! Trend reversal, dip-buying, and sell-on-rise】
An indicator that shines when used in combination with RCI — BODSOR and mBDSR
and methodology and case studies (PDF) ★GogoJungle AWARD2020 winner★
https://www.gogojungle.co.jp/tools/indicators/11836
MT5 features20-minute chart is provided as standard.
GBP/USD 20-minute chart
Above on the 20-minute chart,a break of the swing low occurs,near the swing low it rises up to,the mBDSR (RCI two-filter) overbought signal lights up and the price continues to fall.
If you drop from the higher timeframe to the lower timeframe (in this case, the 20-minute chart) using the three RCI lines and wait for the overbought signal, you can enter with even stronger justification; the explanation of this method is left to the attached PDF. It is not a random look at the 20-minute chart.
From this example,a trading method focused on Dow Theory andthe signals of mBDSR show a high degree of compatibility.
※ Please note that the charts introduced in this article may have added circles, straight lines, or boxes for convenience of explanation.
Indicator that shines when combined with RCI【BODSOR・mBDSR】
and methodology and case studies (PDF) ★GogoJungle AWARD2020 winner★
https://www.gogojungle.co.jp/tools/indicators/11836
The PDF file contains 358 items (over 1,400 pages, over 470,000 characters in total).
Most of them arecarefully laid out examples that use three-line RCI to logically link higher and lower timeframes, examine the status of multiple lower timeframes sequentially, and ultimately wait for dip-buying or a sell-on-rise timing (i.e., mBDSR signals) on the lower timeframe.
Additionally,many entries focus on identifying points where multiple entry reasons overlap.
Furthermore,the method also includes exploring upside and downside targets using three-line RCI..
In the explanations within the PDF file,more than 1,350 chartsare used.
× ![]()


