

[RCI3 Three-Line Plus mBDSR] Canadian Dollar/Yen 15-minute chart Example of a Reversal Sell Signal
※Campaign is ongoing until January 10, 2019.
The sales page for BODSOR ishere.
※ BODSOR is an indicator developed to improve entry accuracy when buying on dips or selling on rallies using the RCI with three lines.
to increase accuracy.
This time, an extra indicator 【mBDSR】 has been included with【BODSOR】.
【mBDSR】 (extra indicator):
Its development concept is the same as【BODSOR】, but the arrow signal generation conditions and calculations are completely
different.
Because more arrow signals occur than with【BODSOR】, there is a higher likelihood of capturing entry opportunities that【BODSOR】could not grasp.
The figure below is a 15-minute chart of the Canadian dollar-yen pair.
Canada dollar yen 15-minute chart
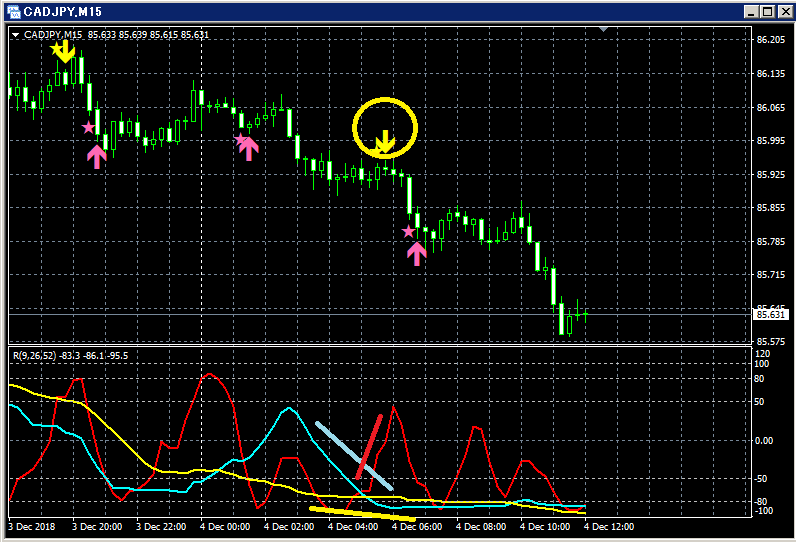
Upper part: mBDSR
Lower part: RCI three-line (red: RCI9, light blue: RCI26, yellow: RCI52)Among the three RCI lines, only RCI9 is clearly rising.
If RCI9 turns down, all three RCIs may move downward.
In other words, price may also decline strongly.
In such a situation,the mBDSR
Immediately after the signal lights, seven bearish candles occur in succession, and thereafter price continues to fall smoothly
as shown.
The sales page for BODSOR ishere.

Twitter
https://twitter.com/RCIX3Line
Blog
http://bodsor.blog.fc2.com/
Investment Navi+
https://fx-on.com/navi/serial/?id=359
YouTube
https://www.youtube.com/channel/UCL-g5uAlesiWVJEDtWlFvGw
Examples of push‑ahead buying and pullback selling signals on USD/JPY 1-hour chart
※In charts within this article, for convenience of explanation, circles, lines, and squares may be drawn, so please be aware.
Please understand.


