

【RCI3 single line + mBDSR】AUDUSD 15-minute chart pullback buying signal example
※Campaign is ongoing until January 10, 2019.
The BODSOR sales page is here.
※ BODSOR is an indicator developed to increase entry accuracy when performing pullback buying or pullback selling using the RCI 3-line setup.
This time, an extra indicator 【mBDSR】 has been included with 【BODSOR】.
【mBDSR】 (the bonus indicator):
The development concept is the same as for 【BODSOR】, but the arrow signal generation conditions and its calculation method are completely
different.
With more arrow signals than 【BODSOR】, it increases the likelihood of catching entry opportunities that could not be captured with 【BODSOR】.
The figure below is a 15-minute chart of AUDUSD.
AUDUSD 15-minute chart
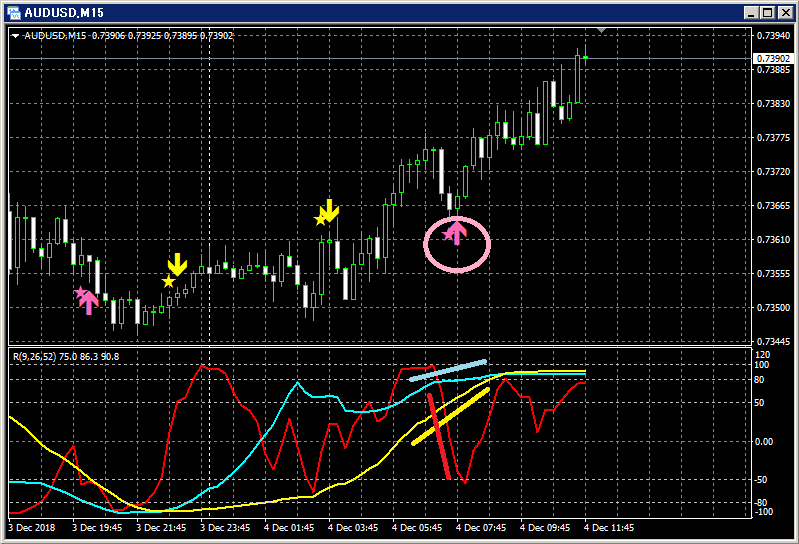
Upper row:mBDSR
Lower row: RCI three-line indicator (red: RCI9, light blue: RCI26, yellow: RCI52)
Among the three RCI lines, only the RCI9 is clearly declining.
If RCI9 reverses and rises, all three RCI lines may rise, suggesting a potential entry point.
In other words, the price may rise strongly.
In such a scenario,mBDSR’s pullback-buy signal (pink arrows circled) lights up.
Immediately after the signal lights, three solid bullish candles appear, and the price continues to rise steadily,
as can be seen.
The BODSOR sales page is here.

Twitter
https://twitter.com/RCIX3Line
Blog
http://bodsor.blog.fc2.com/
Investment Navi+
https://fx-on.com/navi/serial/?id=359
YouTube
https://www.youtube.com/channel/UCL-g5uAlesiWVJEDtWlFvGw
Example of pullback buying and pullback selling signals on the USD/JPY 1-hour chart
※In the charts within this article, for ease of explanation, yen marks, straight lines, and rectangles may be drawn.
Please understand.
× ![]()


