

【RCI3 three-line + mBDSR】 Canadian Dollar / Japanese Yen 30-minute chart - example of pullback sell signal
Campaign is ongoing until January 10, 2019.
BODSOR sales page is here.
BODSOR is an indicator developed to improve entry accuracy when placing buy orders on dips or selling on rallies using three RCI lines.
This time, an附属 accessory indicator mBDSR has been included with 【BODSOR】.
【mBDSR】 (the附属 indicator):
Its development concept is the same as 【BODSOR】, but the arrow signal generation conditions and their calculation method are completely different.
【BODSOR】 generates fewer arrows, whereas 【mBDSR】 can capture entry opportunities that 【BODSOR】 could not.
There is a higher possibility of catching entry opportunities that were not detectable with 【BODSOR】.
The figure below is a 30-minute chart for the Canadian Dollar / Japanese Yen.
Canadian Dollar / Japanese Yen 30-minute chart
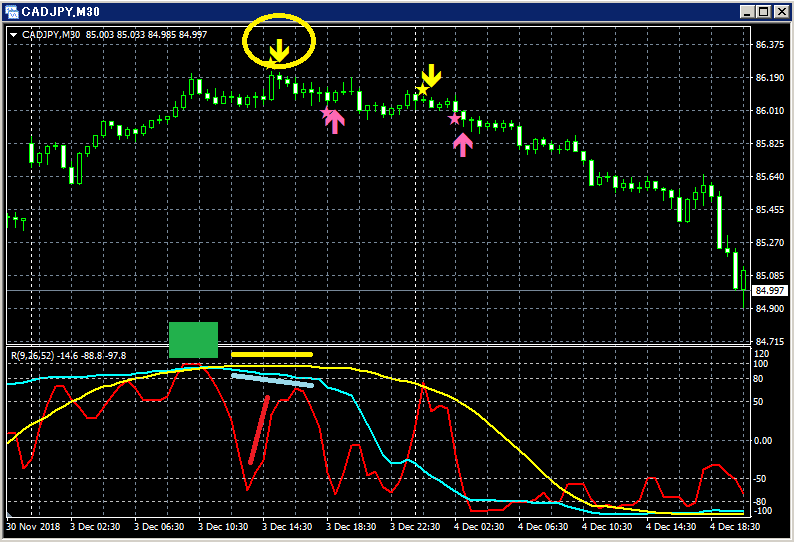
Top row:mBDSR
Of the three RCI lines, only RCI9 is clearly rising.
If RCI9 starts to reverse downward, all three RCI lines may turn down together.
In other words, price could undergo a strong decline.
In such a scenario,the mBDSR reversal sell signal (yellow arrows circled) is lighting up.
Right after the signal lights, three consecutive bearish candles appear, and prices continue to decline afterward.
This is a highly typical pattern where the signal lights even after the RCI triple top, when RCI9 pulls back.
BODSOR sales page is here.

Twitter
https://twitter.com/RCIX3Line
Blog
http://bodsor.blog.fc2.com/
Investment Navi+
https://fx-on.com/navi/serial/?id=359
YouTube
https://www.youtube.com/channel/UCL-g5uAlesiWVJEDtWlFvGw
Example of buy on dips and sell on rallies on USD/JPY 1-hour chart
※In the charts within this article, for convenience of explanation, circles, lines, and rectangles may have been drawn, so please understand.
Please note this.


