

[RCI3 Three-line + mBDSR] Nikkei Stock Average Futures 1-Hour Chart Example of a Rebound Sell Signal
※Campaign is ongoing until January 10, 2019.
The sales page for BODSOR (mBDSR) ishere.
BODSOR is an indicator developed to improve entry accuracy when making pullback buys or pullback sells using the RCI3-line.
This time, the bonus indicator 【mBDSR】 has been included with 【BODSOR】.
【mBDSR】 (Bonus Indicator):
The development concept is the same as for 【BODSOR】, but the arrow signal generation conditions and its calculation method are completely different.
Because more arrow signals occur than with 【BODSOR】, there is a higher possibility of capturing entry opportunities that could not be captured with 【BODSOR】.
The figure below is the one-hour chart of Nikkei 225 futures.
Nikkei 225 futures one-hour chart
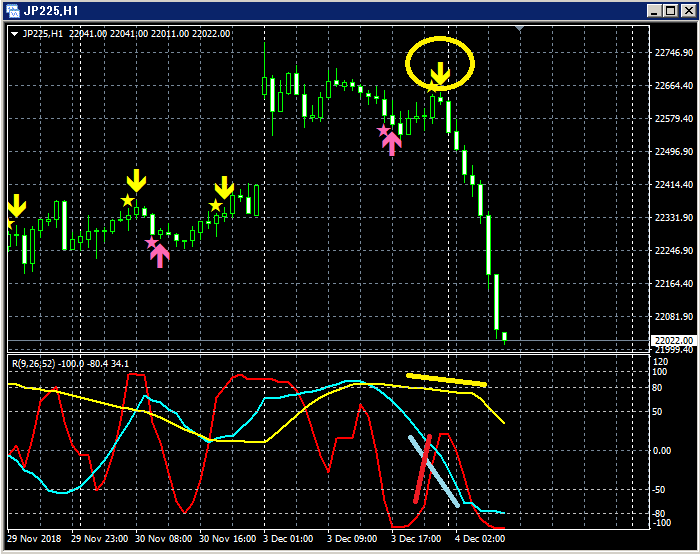
Upper row:mBDSR
Only RCI9 among the three RCI lines is clearly rising.
If RCI9 turns downward, all three RCI lines may decline simultaneously.
In other words, the price may undergo a strong decline.
In such a situation, the mBDSR’s pullback sell signal (yellow arrows circled) is lit..
Immediately after the signal lights, nine consecutive bearish candlesticks appear, and the price drops sharply, as can be seen.
This can be observed.
Note that the downward reversal of rising RCI9 is confirmed only after three bearish candles have formed.
The sales page for BODSOR (mBDSR) ishere.
Twitter
https://twitter.com/RCIX3Line
Blog
http://bodsor.blog.fc2.com/
Investment Navi+
https://fx-on.com/navi/serial/?id=359
YouTube
https://www.youtube.com/channel/UCL-g5uAlesiWVJEDtWlFvGw
Examples of Buy on Dips and Sell on Rallies for USD/JPY on the 1-hour chart
※In the charts within this article, for convenience of explanation, yen marks, straight lines, and squares may be drawn; please note this.
Please acknowledge.


