

【RCI3 One-Line + mBDSR】AUDUSD 15-minute Chart Example of a Reversal Sell Signal
※Campaign is ongoing until January 10, 2019.
BODSOR sales page is here.
※ BODSOR is an indicator developed to improve entry accuracy when buying on dips or selling on rallies using the RCI3-line.
This time, a bonus indicator【mBDSR】is included with【BODSOR】.
【mBDSR】(Bonus indicator):
The development concept is the same as【BODSOR】, but the arrow signal generation conditions and its calculation method are completely
different.
Since more arrow signals are generated than with【BODSOR】, it increases the likelihood of capturing entry opportunities that could not be caught with【BODSOR】.
The figure below is the 15-minute chart of AUDUSD.
AUDUSD 15-minute chart
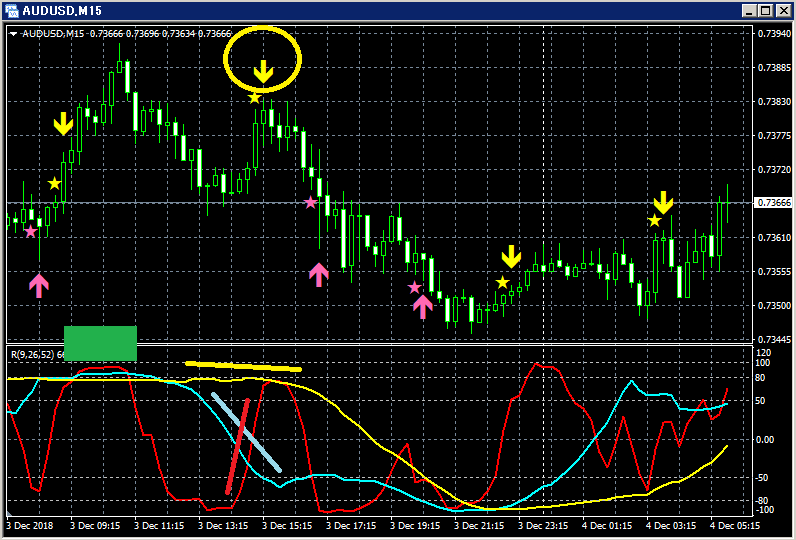
Top row:mBDSR
Among the three RCI lines, only RCI9 is clearly rising.
If RCI9 turns downward, all three RCI lines may turn downward, a scenario where
price could also fall strongly.
In such a situation,mBDSR signal for a retrace (yellow arrows circled) lights up.
You can see that after the signal lights, the price declines smoothly.
Retracement after the signal is only a few pips.
In other words, a common pattern near a “triple top on the RCI” where the short-term line of the RCI3, the RCI9, dips and then
retraces its move.
BODSOR sales page is here.

Twitter
https://twitter.com/RCIX3Line
Blog
http://bodsor.blog.fc2.com/
Invest Navi+
https://fx-on.com/navi/serial/?id=359
YouTube
https://www.youtube.com/channel/UCL-g5uAlesiWVJEDtWlFvGw
Examples of buy on dips and sell on rallies on USD/JPY 1-hour chart
※In the charts within this article, for convenience of explanation,円 (yen), straight lines, and squares may be drawn/added, so please understand.
.


