

Sign from 【RCI3 Main Line+mBDSR】 shows trend reversal (Gold/USD 1-hour chart)
※Campaign is ongoing until January 10, 2019.
BODSOR (mBDSR)sales pagehere.
※ BODSOR and mBDSR are indicators developed to enhance the entry accuracy when applying buy-the-dip or sell-the-rally using the RC I3-line.
The figure below is a 1-hour chart of Gold / US Dollar (XAUUSD).
Gold/USD (XAUUSD) 1-hour chart
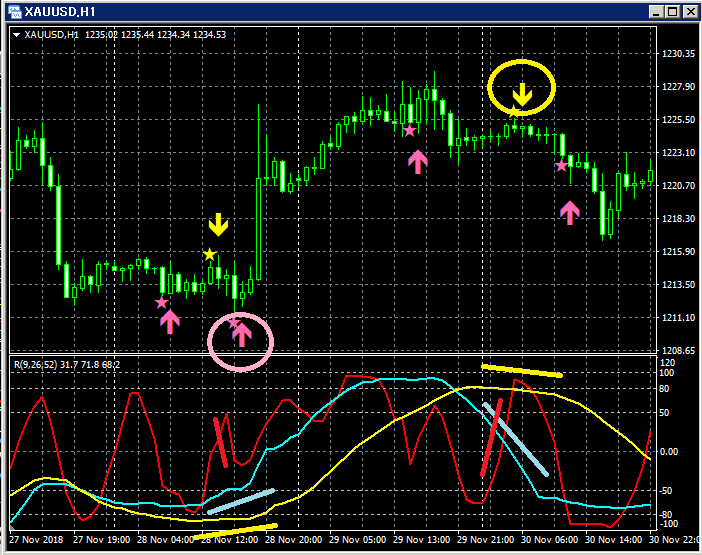
Top row:mBDSR
(1) Signs of upturn in RCI52
(2) The “RCI three lines + mBDSR” dip-buy signal lights up(pink arrows circled)
(3) Signs of downtrend in RCI52
(4) The “RCI three lines + mBDSR” pullback-sell signal lights up(yellow arrows circled)

Twitter
https://twitter.com/RCIX3Line
Blog
http://bodsor.blog.fc2.com/
Investment Navi+
https://fx-on.com/navi/serial/?id=359
YouTube
https://www.youtube.com/channel/UCL-g5uAlesiWVJEDtWlFvGw
Examples of buy-the-dip and sell-the-rally signals on the USD/JPY 1-hour chart
※ In the charts within this article, for convenience of explanation, circles, straight lines, and squares may be drawn
as needed, so please understand.


