

【RCI3 Three Line + mBDSR】Pound-Dollar 5-minute Chart Example of a Rebound Sell Signal
Campaign is ongoing until January 10, 2019.
The BODSOR sales page ishere.
BODSOR is an indicator developed to improve entry precision when buying on dips or selling on rallies using the RCI3-line.
toighten
This time, an附加附属 indicator【mBDSR】has been included with 【BODSOR】.
【mBDSR】 (the附。 extra indicator):
Its development concept is the same as that of 【BODSOR】, but the arrow signal generation conditions and their calculation method are completely different.
There are more arrow signals than【BODSOR】, increasing the likelihood of capturing entry opportunities that【BODSOR】couldn’t grasp.
Therefore, the chances of catching entry opportunities may be higher.
The figure below is the 5-minute chart of GBP/USD.
GBP/USD 5-minute chart (December 3, 2018)
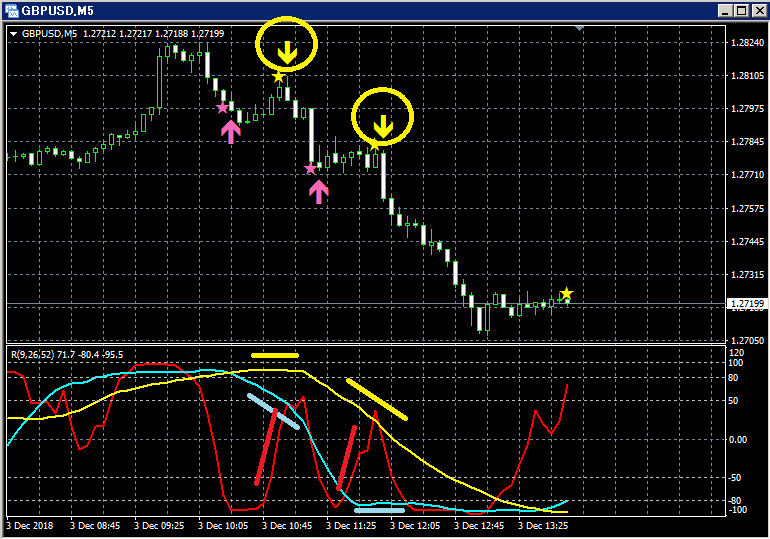
Top row:mBDSR
Only the RCI9 among the three RCI lines is clearly rising.
If the RCI9 reverses downward, all three RCIs may move downward together.
In other words, the price may undergo a strong decline.
In such a scenario,mBDSR’s reversal-sell signals (yellow arrows circled) light up twice
.
In the first signal, immediately after the signal lights, two bearish candles appear consecutively, and the price continues to fall smoothly.
This shows that the price is declining steadily.
In the second signal, immediately after the signal lights, three bearish candles appear consecutively, and the price continues to fall smoothly.
This shows that the price is declining steadily.
The BODSOR sales page ishere.

Twitter
https://twitter.com/RCIX3Line
Blog
http://bodsor.blog.fc2.com/
Invest Navi+
https://fx-on.com/navi/serial/?id=359
YouTube
https://www.youtube.com/channel/UCL-g5uAlesiWVJEDtWlFvGw
Examples of pullback buys and pullback sells on the USD/JPY 1-hour chart
※In the charts within this article, for convenience of explanation, circles, lines, and rectangles may be drawn, so please understand.


